
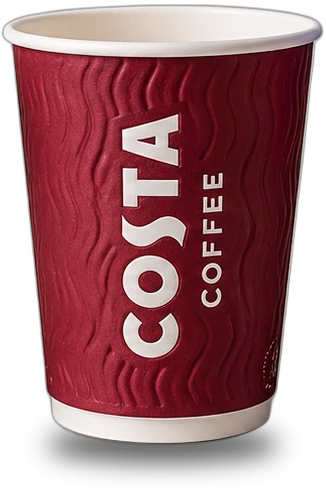
MolGod classroom kit · one molecule · 45 or 60 minutes
From the cup in their hand to the spectrum on the wall
A coffee cup, an energy-drink can, a blind smell test, a 3D-printed caffeine molecule with an engraved symbol on every atom, caffeine crystals glowing under polarised light and ten real spectra on the projector. Everything a teacher needs to take one molecule from the cup in a student’s hand to the data chemists use to identify it.
Free to use · printable models · minute-by-minute script · 23 projector slides · worksheet, test and answer key · live 3D viewer
Start the 45-minute lesson → Teach it in our research pilot → Open the projector slides →
For a busy teacher
Start in 3 steps
- Print. The worksheet and test, one per student, and the answer key for you.
Worksheet + test (PDF, 2 pages) Answer key (PDF) - Project. The 23 slides are built into this page: open them full screen on the projector, or show the live 3D caffeine viewer with ten spectra.
Open the slides Open the 3D viewer - Teach. Follow the 45-minute script with props, minute by minute; one printed model per pair of students.
Read the script Script (PDF, 8 pages) Free printable model
One substance, four ways of knowing it
The 45-minute core lesson is a case with four exhibits. Each gives students a different kind of evidence about the same substance; crystals under polarised light are an optional extension.
Exhibit A · the nose
Blind smell test
ground coffee, energy drink, caffeine in water, plain water: which two smell exactly alike?
Exhibit B · the label
Read the can
mg per 100 ml to mg per can to molecules
Exhibit C · the hand
The model
24 atoms to count, read and turn
Exhibit D · the instrument
Spectra
IR, NMR, mass spectrum, live in the viewer
The verdict
Substance vs mixture
a conclusion, its reason and one limitation
Two formats: lecture hall or classroom
The lesson works in a lecture hall with a lecturer on stage and everything on a big screen, and in a classroom. In both, every pair of students holds a real engraved model: that is what makes the lesson different from a slideshow.
- In a lecture hall, the lecturer runs the demonstrations,
- the projector makes them visible to the back row,
- and the students check every claim on the model in their own hands.
1 · The screen, for everyone
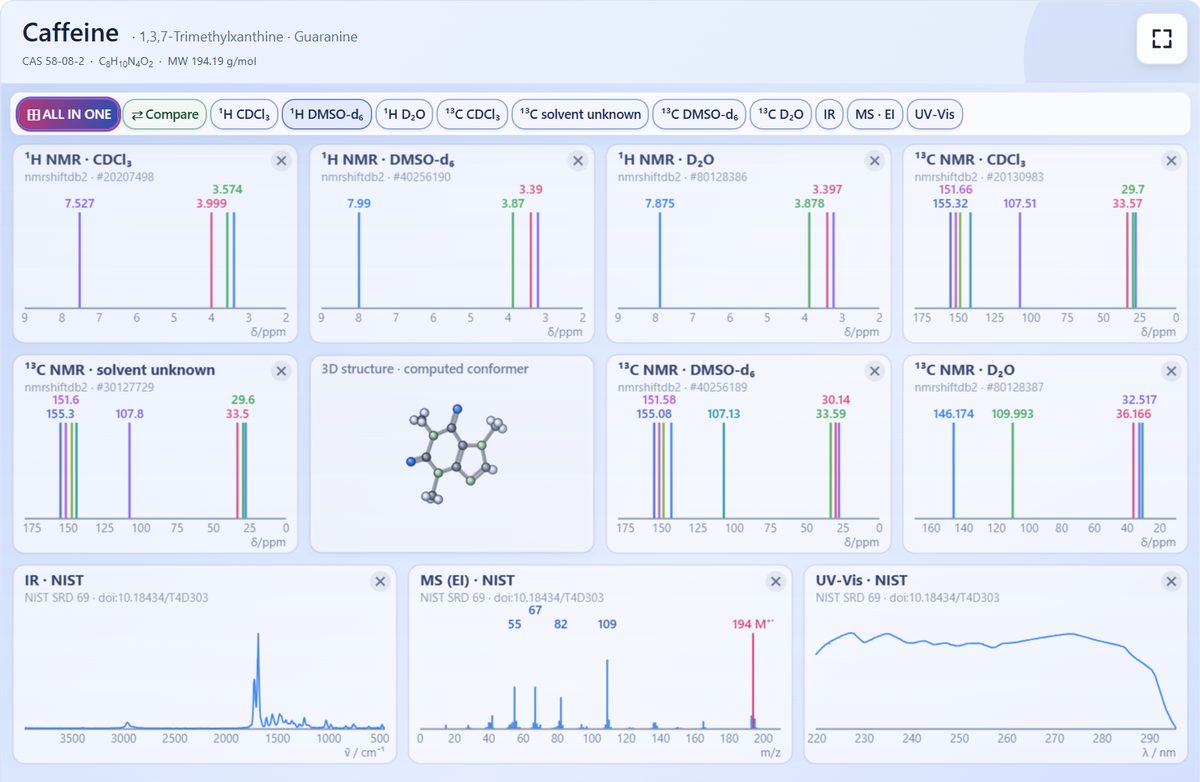
The 23 slides in full screen, the live 3D viewer with its ten spectra, and the live picture from the lecturer’s desk.
2 · The lecturer, on stage
Cups and cans, the four jars and the sealed vial, and the lecturer’s own engraved model under a document camera (or a phone on a stand), so that when the lecturer points to an atom, every letter is visible on the big screen. For the extended lesson: the IR spectrometer and crystals under a camera.
3 · The students, model in hand
- a printed engraved model for every pair, even in a hall of a hundred: MolGod supplies class sets of models: ask us at pure@molgod.org about availability, shipping and timing for your class.
- in one randomised study, handling physical 3D-printed models for three to five minutes improved learning gains (Boiangiu, Popa & Mihășan, 2025).
- That study tested physical models in general, not engraved ones and not models against screens; whether the engraved letters add anything is exactly what our research proposal sets out to test;
- predict before every reveal: a show of hands, or your institution’s own polling tool;
- three to five volunteers come to the front for the smell test, while the hall predicts and votes; nobody sprays a smell into the room;
- the worksheet and the test on paper or on their phones;
- the self-test and the rotating model on the research page, on their own phones.
Lecturer’s screen and audience screen.
- With the projector set to extend the desktop, open the slides on the projector in full screen
- press Lecturer view under the slides: a separate window on your laptop shows the script for the current slide, the next slide and a clock, and moves the slides for you.
The audience sees only the slides. A live voting system with QR join, pseudonyms and a lecturer dashboard is being designed as the next MolGod Classroom feature; until then, use a show of hands or your own polling tool.
What is in the kit
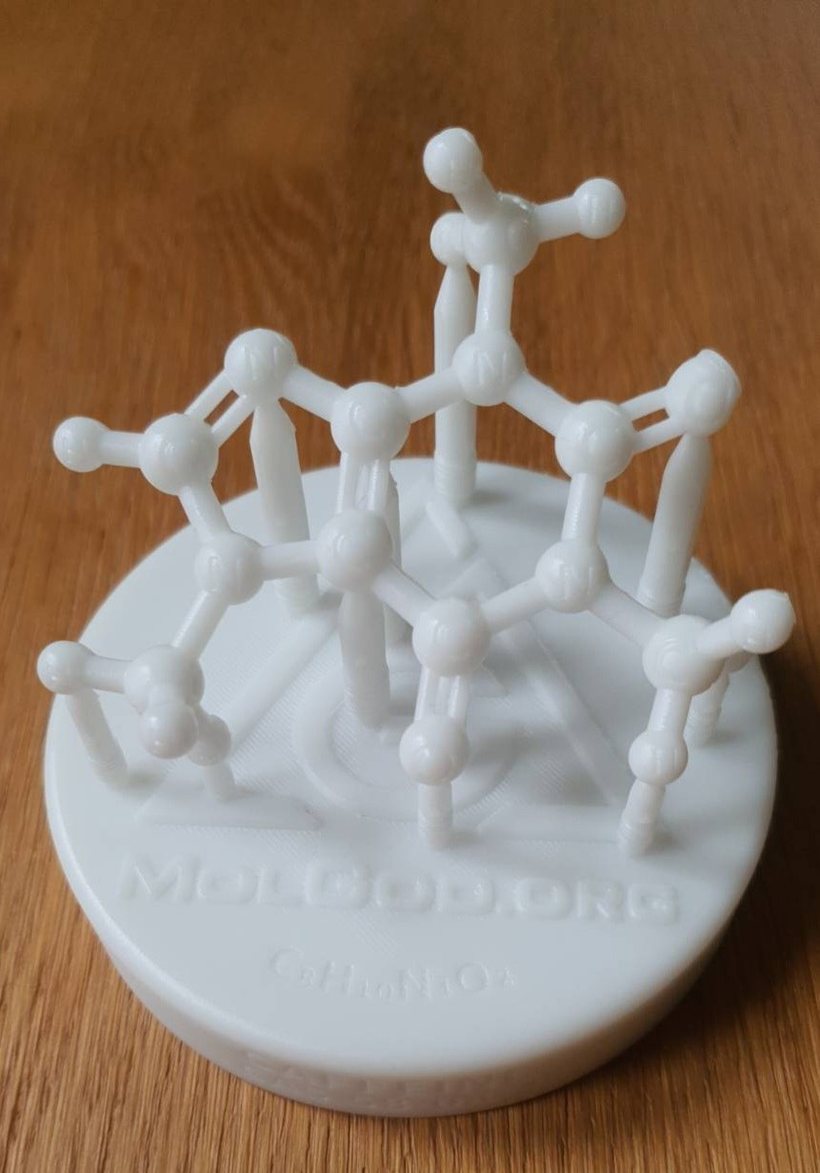
The engraved model
- One per pair. Our real print, shown here, is single-colour: every atom carries its engraved symbol, so students can read C, H, N and O without a colour key.
- The geometry is procedurally generated by MolGod’s own software from PubChem’s computed 3D conformer, an educational model rather than an experimental crystal structure.
- Free to download from the caffeine page; it prints on any ordinary FDM 3D printer.
The viewer on the projector
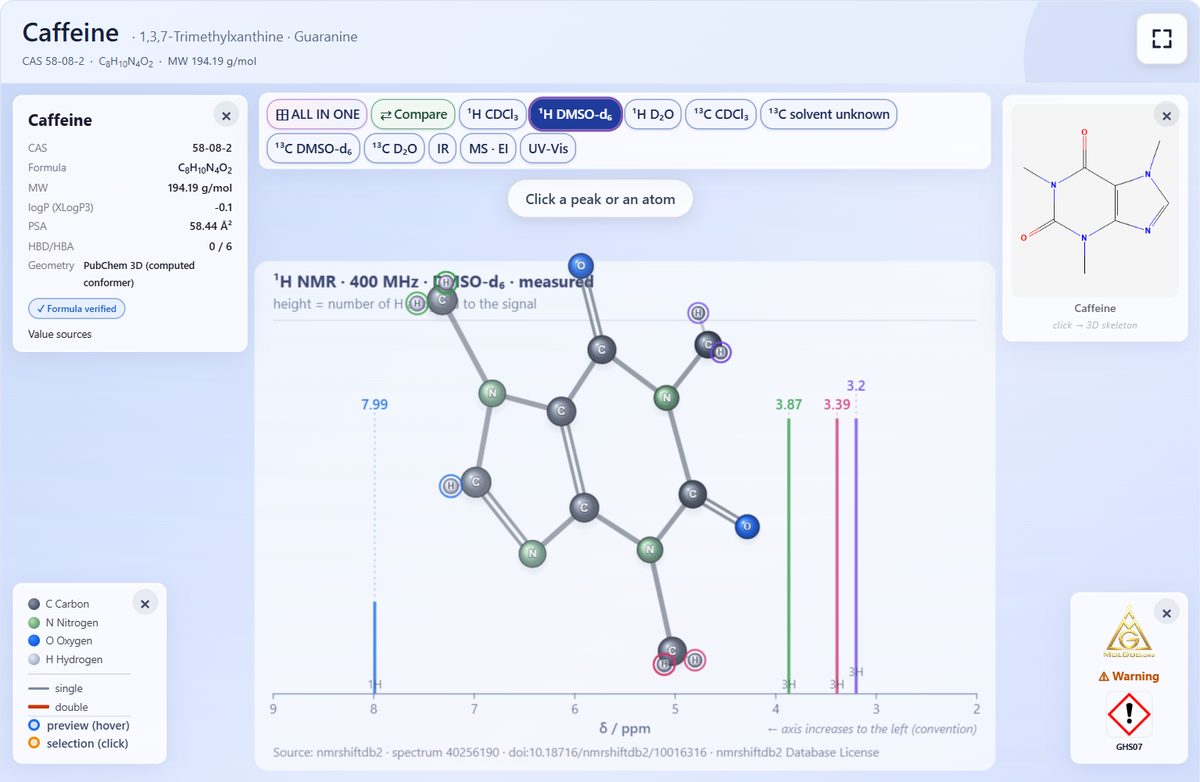
The same molecule in 3D, with ten reference spectra drawn over it: click a peak and the atoms behind it light up. It runs in the browser; nothing to install. Open it below.
From the shop and the prep room
- two or three cups of coffee from different places, in plain cups
- one energy-drink can, brand covered, nutrition label visible
- four identical small closed jars, numbered 1–4 on the bottom only
- pure caffeine from a laboratory or school chemical supplier, with its safety data sheet
- a small sealed transparent vial of solid caffeine, to look at but never to open
- a printout of the 2D structure
For the teacher, on this page
- Set-up list by class size: 10, 20 or 30 students
- Projector mode: 23 lesson slides, no PowerPoint needed
- Minute-by-minute script: props, screen, what to say, expected answers
- Student worksheet, five-question test and answer key, printable
Optional modules
- The hidden ingredient: a can of cola and the research on why caffeine is in it
- Crystals: a laptop screen and a sheet of polarising film
- Infrared: a handheld or benchtop IR spectrometer, if the school has one; otherwise the viewer
- Evidence cube: coming next, one glass object with three methods on its faces
Caffeine in 3D, right here: put it on the projector
This is the live MolGod viewer, the same one as on the caffeine page. Turn the molecule with a finger or the mouse, click any atom, or pick a spectrum from the buttons above the molecule.
- Connect the laptop to the projector and open this page (or the caffeine page).
- Press Full screen (the square icon in the top corner of the viewer), so the molecule fills the wall.
- Choose Flat 2D in the bottom toolbar: the molecule lies still and flat, which reads best from the back row. Keep Atom Labels on.
- Pick a spectrum (¹H NMR, IR, MS · EI, UV-Vis or All in one) and click a peak: the atoms behind it light up and a card explains the band.

Model views
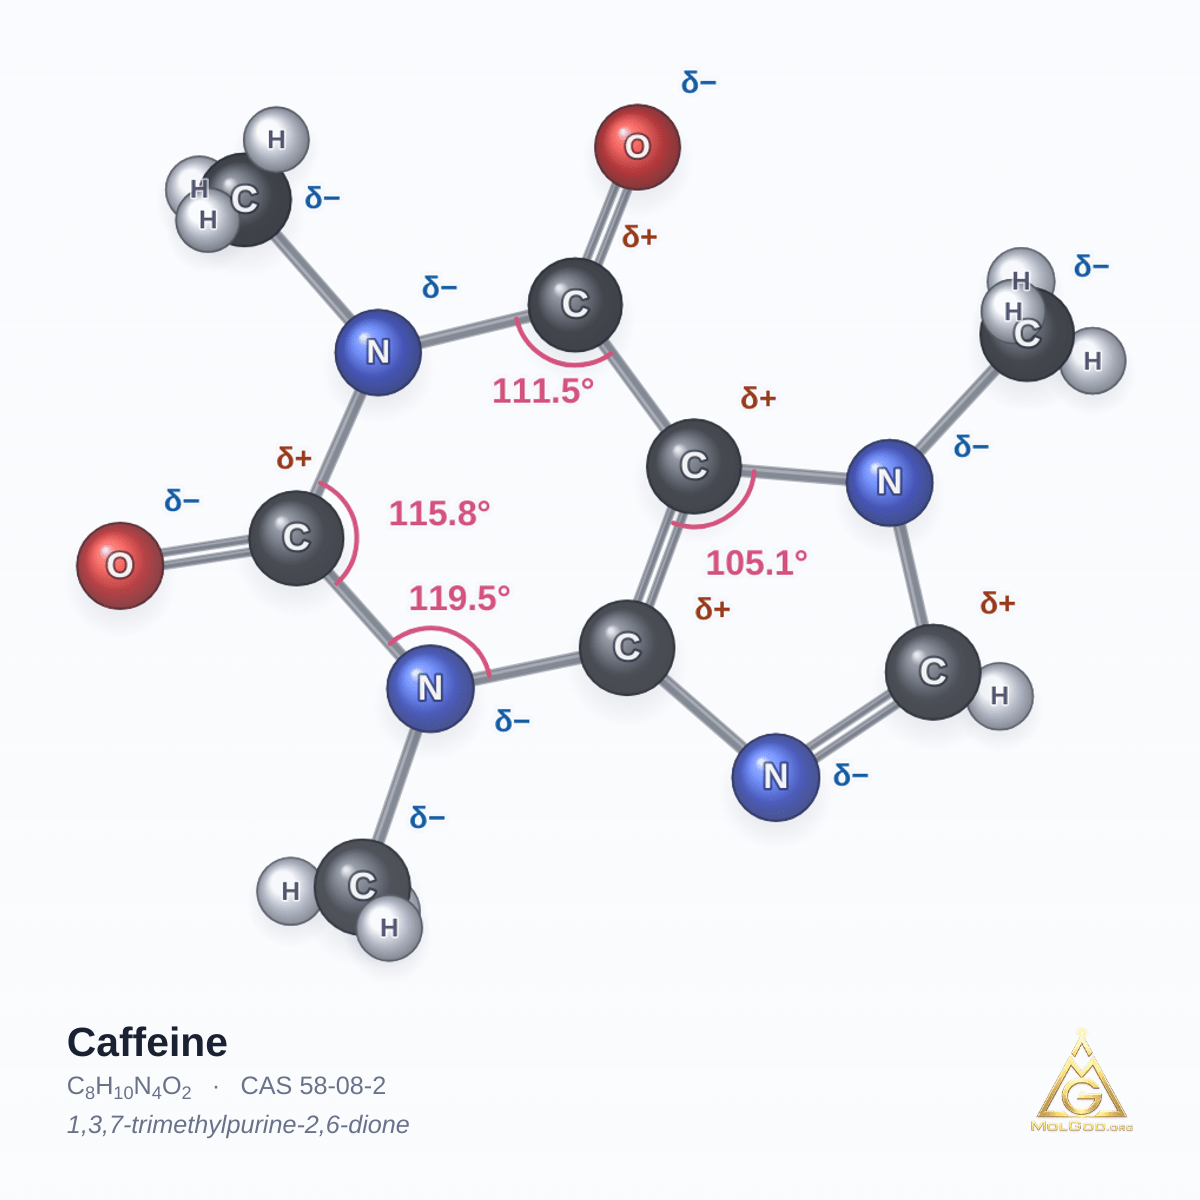
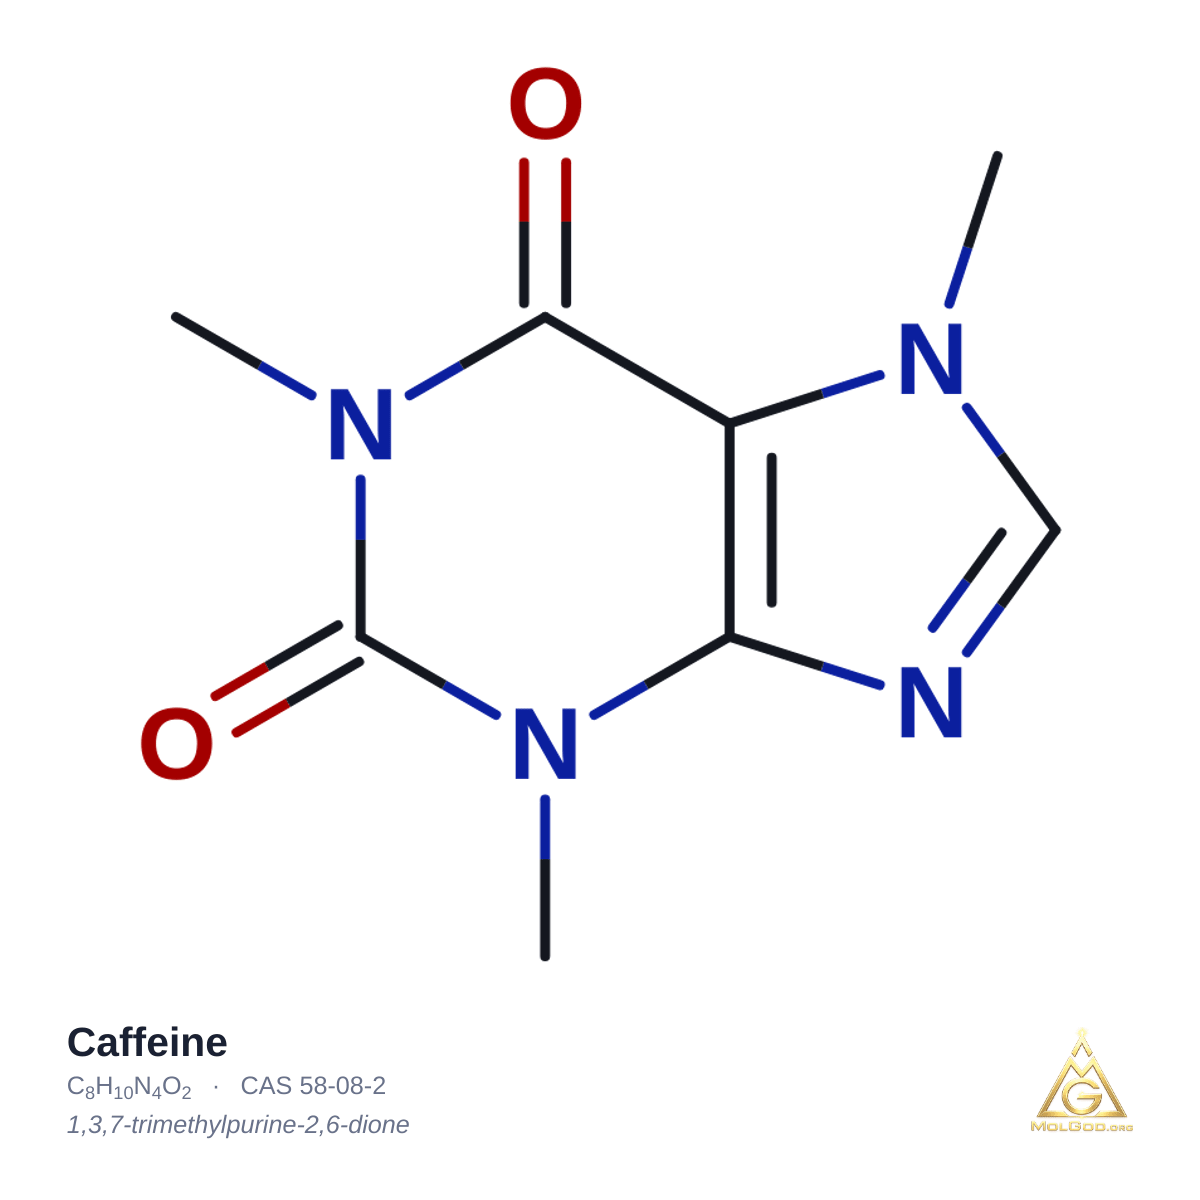
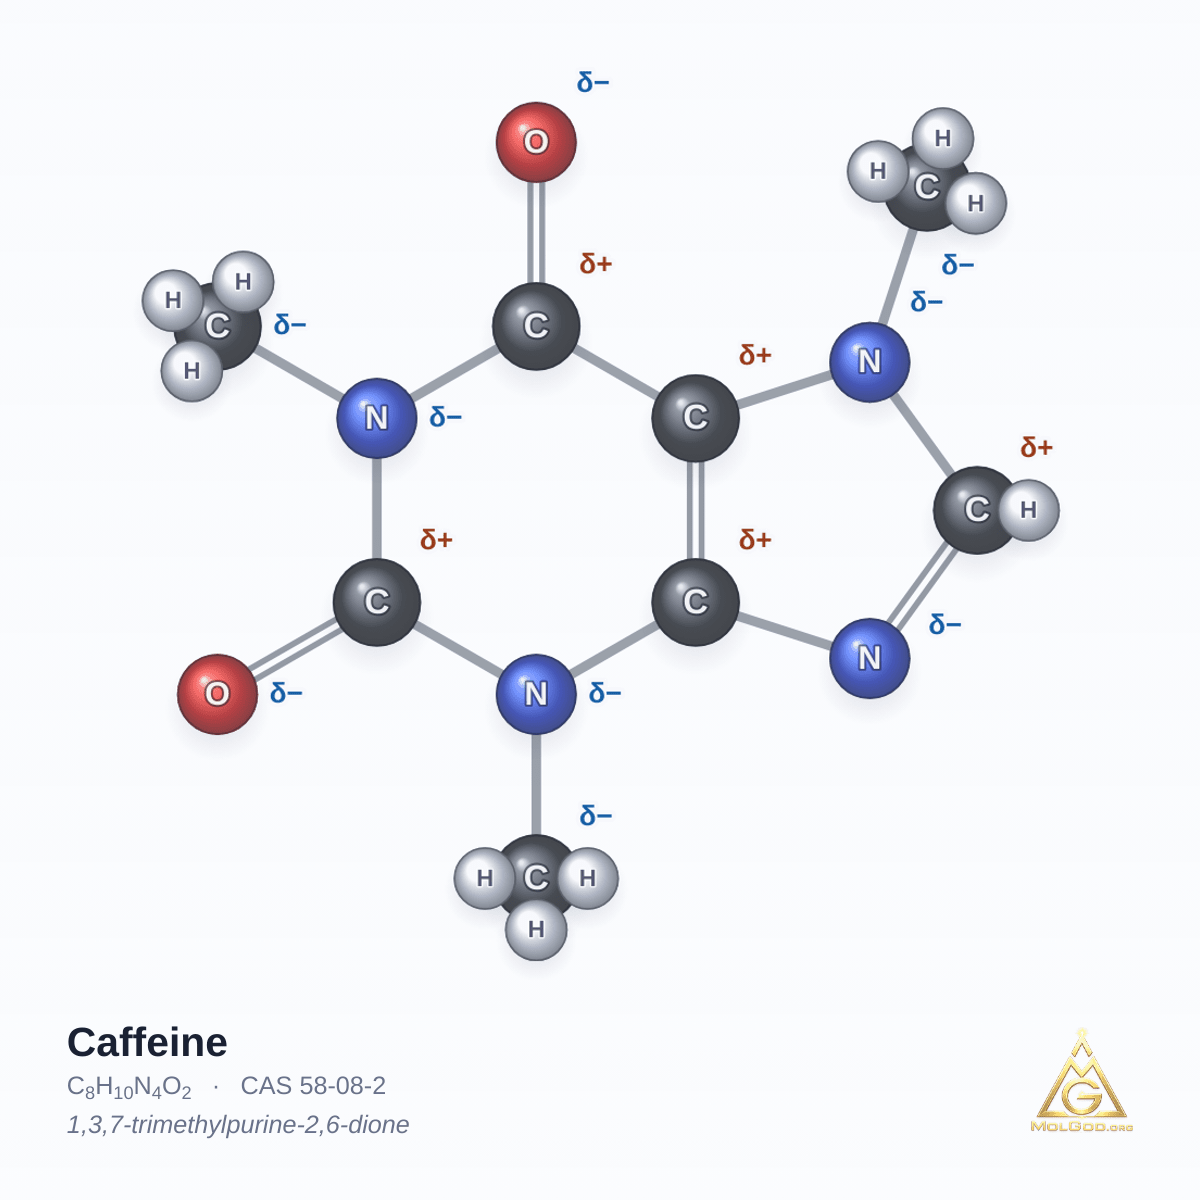
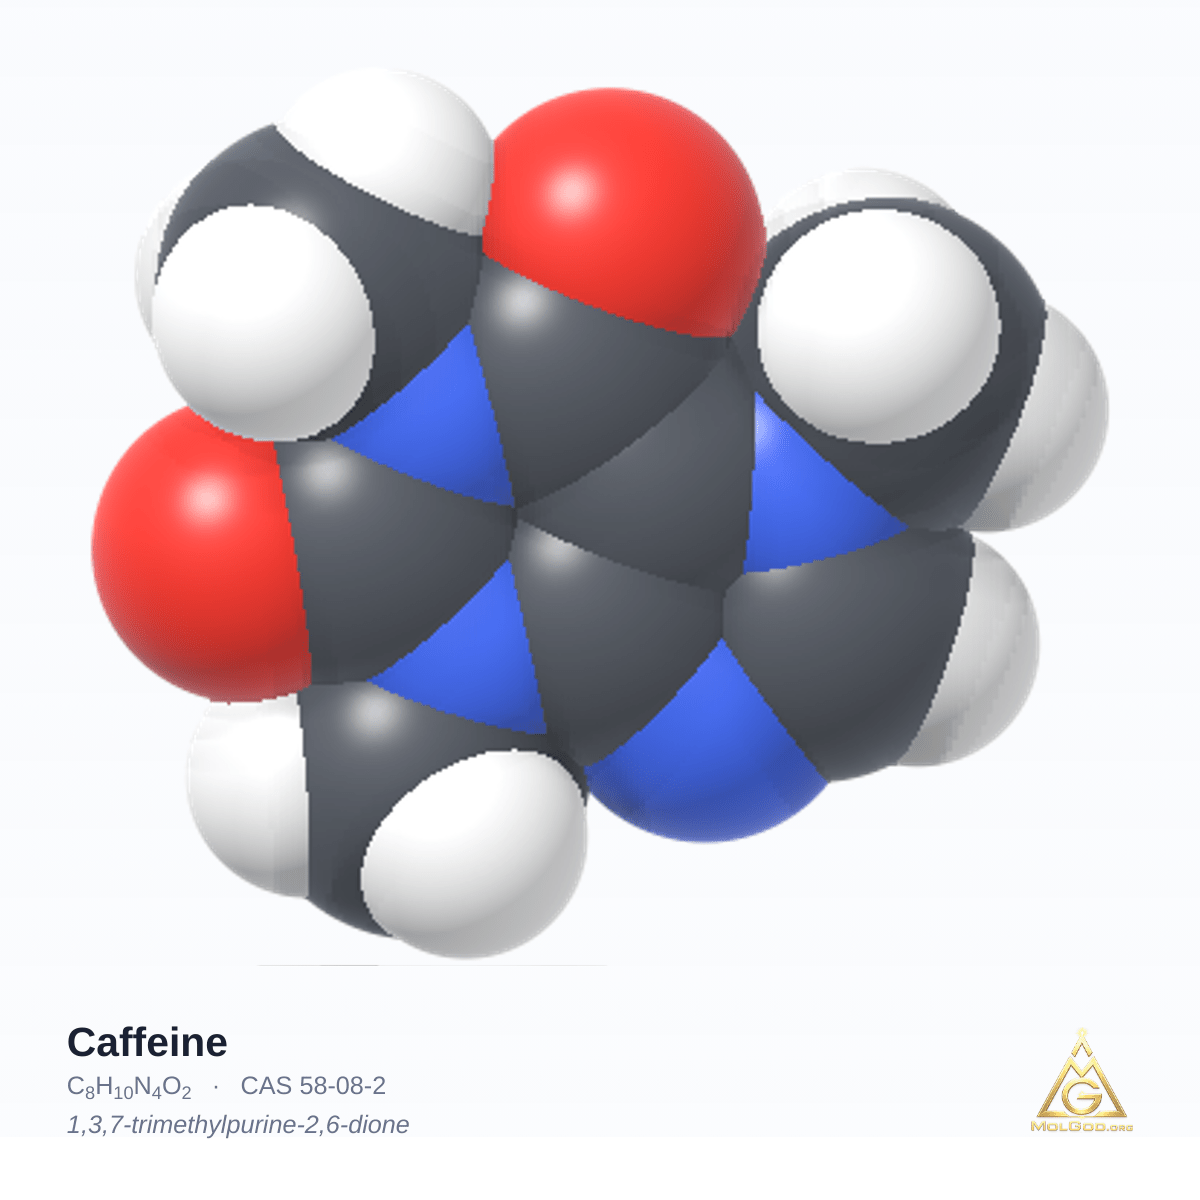
© 2026 MolGod.org. All rights reserved. · Image rights
Read before the lesson
Safety and tone
The demonstrations mentioned here (the smell test, the label calculator, the live IR measurement and the crystals) are explained further down this page.
Nobody drinks or tastes anything; the drinks are props and smell samples only. Pure caffeine is a hazardous substance: its harmonised EU classification is Acute Tox. 4, H302, “Harmful if swallowed” (ECHA, CLP Annex VI, index 613-086-00-5).
- The vial on the desk stays sealed and is never opened in front of the class.
- The smell-test solution is prepared beforehand in the prep room, following the safety data sheet.
- For the live IR measurement in the extended lesson, only the teacher or a trained technician places a few milligrams on the instrument’s crystal, wearing gloves, and cleans it afterwards; the caffeine sample is never passed round.
- The solution jar stays in the teacher’s hands, is labelled on the bottom with its name, concentration, CAS number of the dissolved substance, date and “Not for consumption”, and is never drunk, passed round or poured; wash hands afterwards and follow your school’s risk assessment for chemicals.
- Grow the crystals in the prep room, not in class, take care with the hot water, and show them only sealed; never heat or melt caffeine in the classroom (it melts at about 236 °C; PubChem, citing the CRC Handbook).
- Smelling is optional: use closed jars opened briefly, never sprays, and let students with asthma or a sensitivity to smells skip it and simply hear the result from a classmate.
- Never scent the model itself: caffeine is odourless, so a model that smells of coffee would teach exactly the wrong lesson. Keep brands covered.
Many teenagers drink energy drinks, so let the facts do the work rather than lecturing.
- For adults, EFSA found that single doses of up to 200 mg and habitual intake of up to 400 mg a day raise no safety concerns;
- for children and adolescents it found the data insufficient to derive a safe intake and suggested 3 mg per kg of body weight per day as a basis (EFSA Panel on Dietetic Products, Nutrition and Allergies, 2015).
Work through the label calculator with its hypothetical 50 kg student: that is often the moment the label suddenly becomes interesting. Do not ask students for their own weight.
Before the lesson: set up in ten minutes
Everything on one desk, ready before the bell. Prepare the solution and the jars the day before; print the models well in advance: one caffeine model takes about 8–12 h to print (8 h 19 min to 11 h 51 min in our slicer tests, depending on the printer; see the caffeine page), so a class set takes several days of printing. No printer, or not enough time? Ask MolGod about class sets.
| Item | 10 students | 20 students | 30 students | Used at |
|---|---|---|---|---|
| Engraved caffeine models | 6 | 11 | 16 | 14:00 |
| Coffee in plain cups, from two or three places | 2–3 cups (props only, nobody drinks) | 00:00 | ||
| Energy-drink can, brand taped over, label visible | 1 can (more cans with different labels make the label task richer) | 00:00, 10:00 | ||
| Can of cola, brand taped over, ingredients visible | 1 can (for the hidden-ingredient module) | module | ||
| Smell jars 1–4, numbered on the bottom only | 1 set, stays in the teacher’s hands | 04:00 | ||
| Sealed vial of solid caffeine | 1, never opened | 07:00 | ||
| Student worksheet (below) | 10 | 20 | 30 | all lesson |
| 2D structure printout | 5 | 10 | 15 | 23:00 |
| Document camera or a phone on a stand (lecture hall) | 1, connected to the projector | 04:00–41:00 | ||
| Laptop + projector, this page open | 1 (projector mode and the 3D viewer) | all lesson | ||
The day before
- Jar 3 dissolve pure caffeine in water at about 0.3 g per litre (0.15 g in 500 ml), in the prep room, following the safety data sheet. No pure caffeine available? Run the smell test with jars 1, 2 and 4, show the sealed vial or a photograph of pure caffeine, and tell the class what the full test shows: the caffeine solution smells exactly like water;
- label the bottom with “caffeine solution, about 0.3 g/L”, the CAS number of the dissolved substance (58-08-2), the date and “Not for consumption”.
- The hazard classification of the pure solid (H302) does not transfer automatically to a dilute solution; whether the solution needs a hazard label is for the person responsible for chemical safety at your school to decide.
- Jar 1 a spoonful of ground coffee (a tin of coffee works well).
- Jar 2 a little energy drink. Jar 4 plain water.
- Crystals optional: grow them now (module below).
Ten minutes before
- Desk cups and can in front, jars and vial behind them, models in a box out of sight.
- Screen open projector mode on slide 1; keep the viewer in a second tab.
- Board write the case question: “Case 58-08-2: what is in your cup?”
- Smells ask who prefers to skip the smell test (asthma, sensitivity): they become the class recorders.
Projector mode: the lesson slides, built in
No PowerPoint needed. Twenty-three slides:
- 1–14 the core lesson, told as a case with four exhibits, with the same timings as the plan below;
- 15–21 the cola extension;
- 22 crystals;
- 23 homework.
- Each press of the arrow, the presenter clicker or a tap reveals the next answer, number or step, so the class guesses first and sees the answer second.
- The bar at the top shows how far you are; the 1:00 button starts a one-minute timer for pair work.
- Press Full screen; Esc leaves it.
MolGod lesson 001 · Case 58-08-2
The Chemistry of Coffee
What is in your cup? Identify one molecule from everyday evidence.
You are the scientists. Every stage brings a new exhibit. At the end, you give the verdict.
The case opens
What do all of these have in common?
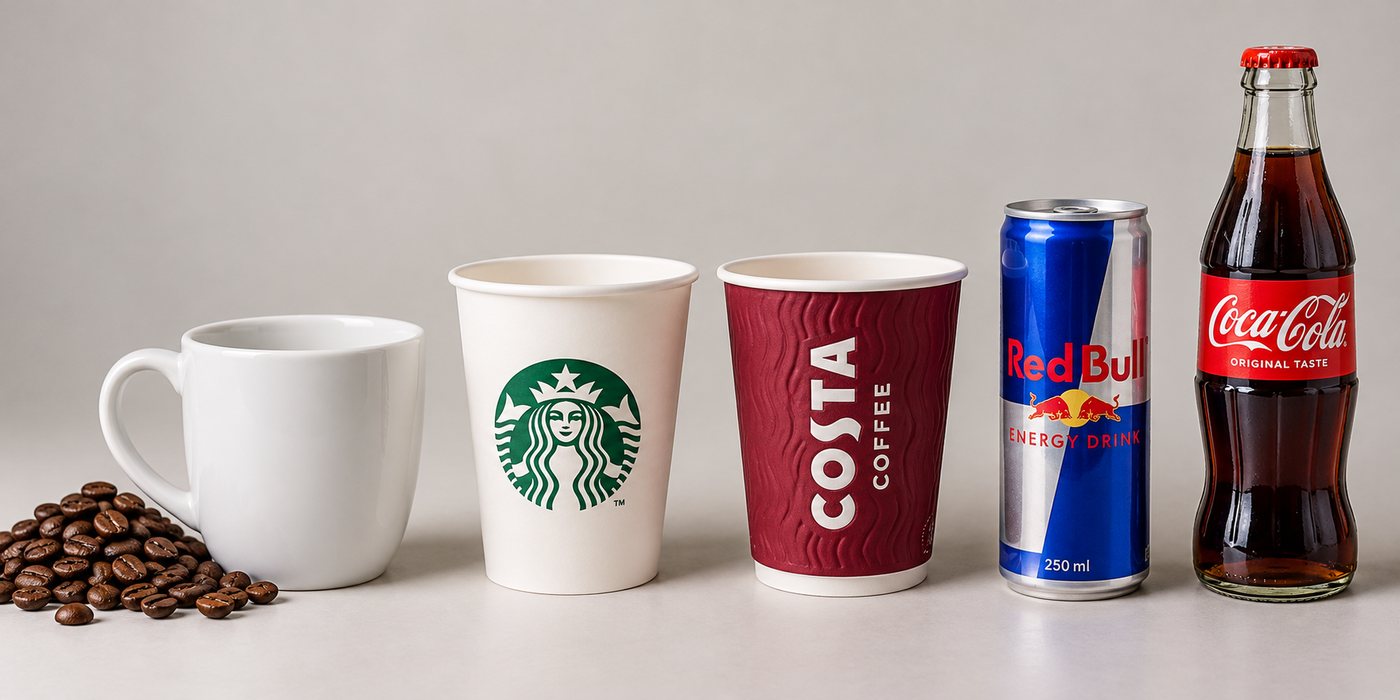
Say it out loud. Every answer goes on the board.
Illustration of everyday context, not photographs of official packaging; do not read caffeine content from it. Brand names identify everyday products only; MolGod is not affiliated with these companies.
First guess
Which molecule do coffee and energy drinks have in common?
Write your answer and how sure you are, from 1 to 5, in box 1. We come back to it at the verdict.
Exhibit A · the nose
Which two jars will smell exactly alike?
Two jars hold things you know, ground coffee and an energy drink; both contain caffeine. One holds caffeine dissolved in water. One holds only water.
Predict which two before anyone smells. Vote with your hand; you can vote without smelling.
Exhibit A · the reveal
What was in the jars?
First: what does the water jar prove?
Jars 3 and 4 smell the same. Coffee and energy drinks contain caffeine too, but their smell comes from other compounds.
Caffeine is a substance with no smell. Coffee is a mixture.
Exhibit B · the label
Find the words “High caffeine content”
EU law: any drink, not only energy drinks, except those based on coffee or tea whose name says “coffee” or “tea”, with more than 150 mg caffeine per litre must say “High caffeine content. Not recommended for children or pregnant or breast-feeding women”, followed by the amount in mg per 100 ml. It must appear in the same field of vision as the drink’s name, in the language of the country of sale.
Now look at the coffee cup. Is there a number?
Exhibit B · do the maths
32 mg per 100 ml × 250 ml ÷ 100 = 80 mg
0.080 g ÷ 194.19 g/mol = 4.1 × 10⁻⁴ mol
4.1 × 10−4 mol × 6.022 × 1023 mol−1 = 2.5 × 10²⁰ molecules
That is 250 000 000 000 000 000 000 copies of the model you are about to hold.
Exhibit C · the molecule in your hands
Read the letters. Count the atoms.
24 atoms in one caffeine molecule. Which hydrogens did you miss?
Exhibit C · molecule detective challenge
Name it from the back. Turn it. Check.
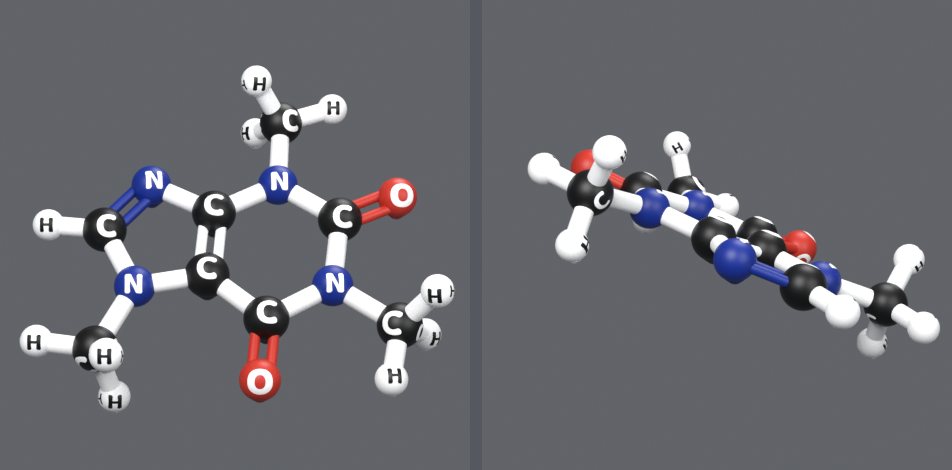
1. From the back: name what you can. 2. Turn and search: 18 of 24 letters face the front, find the other 6. 3. Read the letters and check yourself.
Exhibit C · 3D meets 2D
One molecule, three pictures
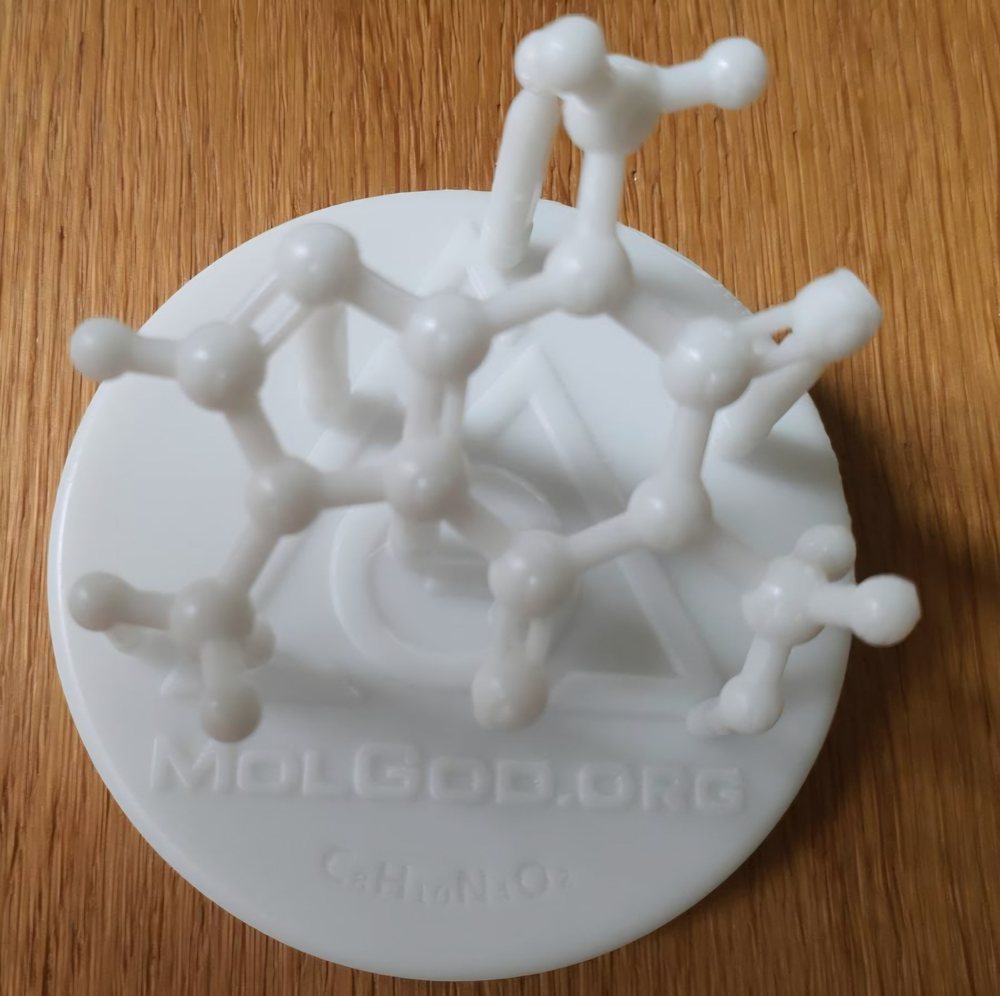
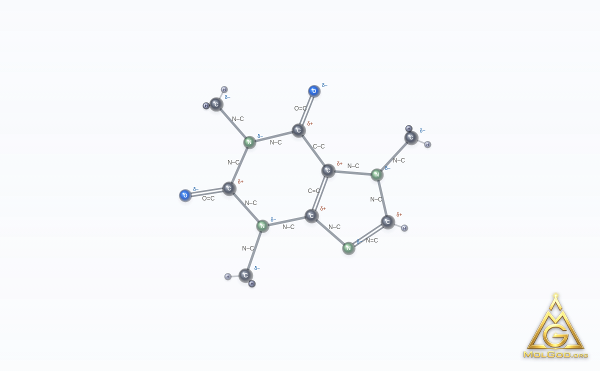
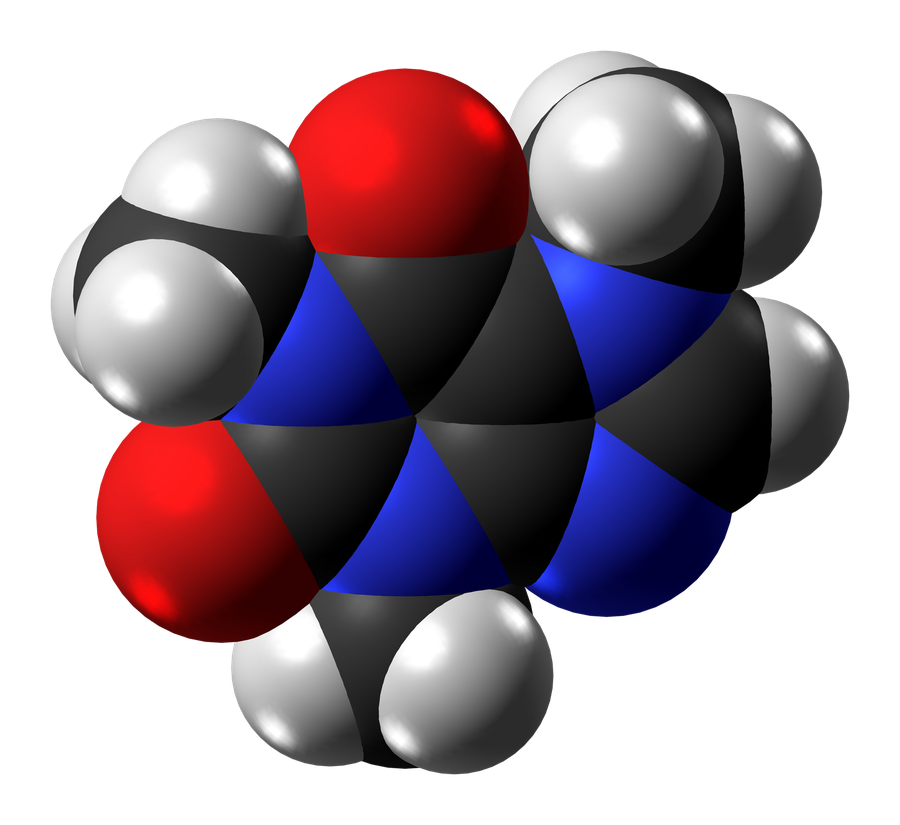
Find: four nitrogens · two C=O double bonds · a ring of five atoms and a ring of six.
Space-filling image: Jynto, Wikimedia Commons, CC0
Exhibit D · the spectra
Three challenges. Answer first, then we open the viewer.
- Infrared: which groups give the strongest bands? Point to the region.
- ¹H NMR: ten hydrogens, four signals. Why? Find the signal of the lone ring hydrogen.
- Mass spectrum: which peak is the molecular ion, the whole molecule? Point to it.
Answers: the two C=O groups · three methyl groups plus one ring hydrogen · the molecular-ion peak, M+· at m/z 194: nominal mass 194, consistent with the molar mass of 194.19 g/mol.
The evidence board
Would one peak be enough to identify caffeine?
Vote first: yes or no?
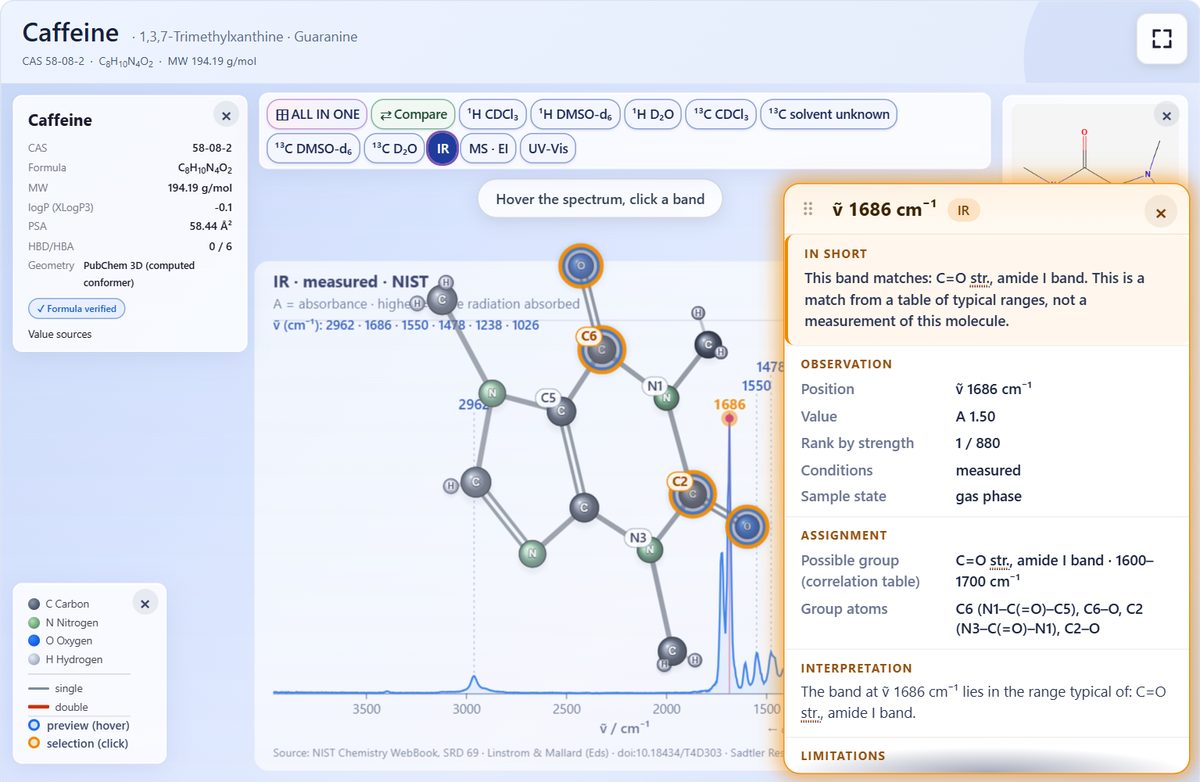
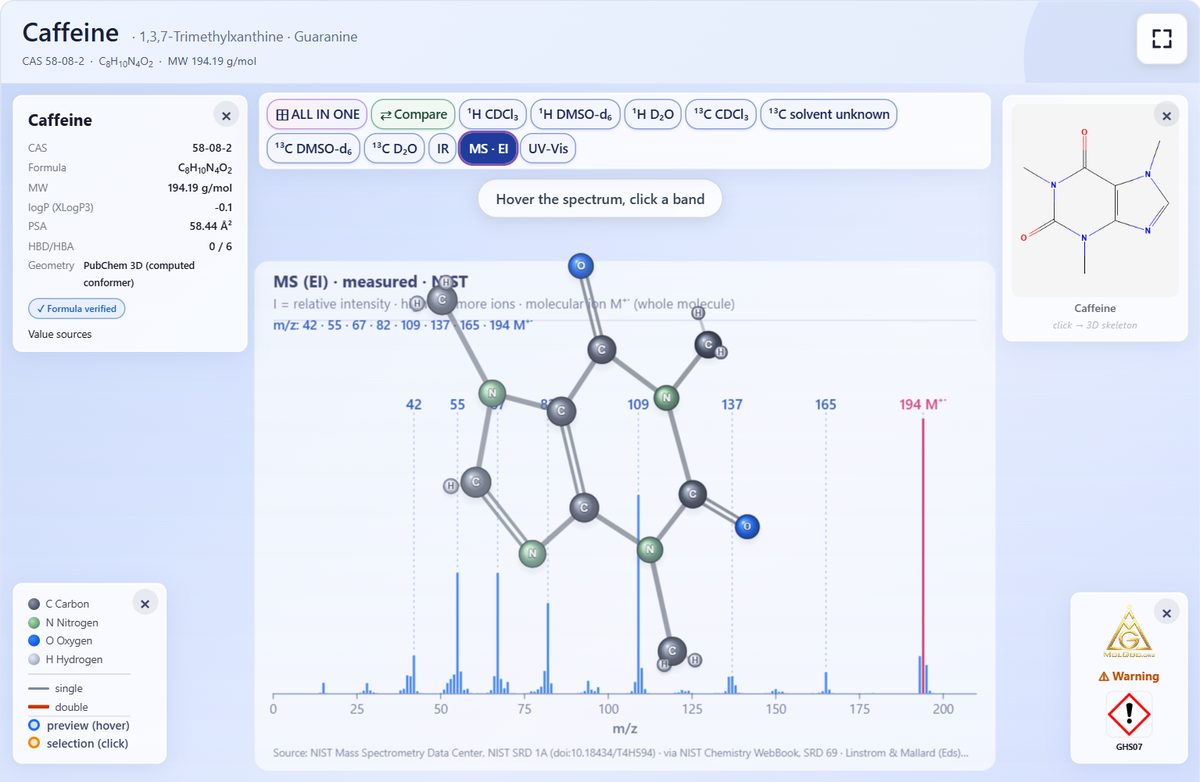
IR: which groups. NMR: which surroundings. MS: how heavy. Only together do they point to one molecule.
Models away
From memory
- The formula of caffeine?
- Why does caffeine not smell of coffee?
- Why does the can carry a warning and the cup not?
- Coffee: one substance or a mixture?
The verdict · Case 58-08-2
What is in your cup: one chemical, or a whole world of molecules?
Back to your first guess: did your answer, or how sure you were, change?
Our conclusion is … because … One limitation is …
Which piece of evidence was strongest, and what could it not prove on its own?
Case closed? You identified the molecule, examined the evidence and found the limits of each test. Now you know not only what caffeine is, but how chemists know.
The hidden ingredient
Coffee, an energy drink, a cola. All three contain caffeine.
Why is it in cola?
Manufacturers have described caffeine as a flavouring ingredient. But can people actually taste it in cola? How would you test that?
Blind taste test · 25 regular cola drinkers
Can they taste the caffeine?
2 of 25
The group as a whole: 53%, the same as guessing. Trained tasters in a second study: 0 of 30.
Three different questions
What does a scientist actually measure?
- Can you taste it?
- Do you choose it?
- Why do you choose it?
Can a substance change what we do even when we cannot taste it?
Taste is not the same as choice · small groups of adult caffeine users
Who repeatedly chose the caffeinated drink?
Nobody knew which drink was which. In a separate withdrawal experiment, avoiding a placebo day was worth $2.51 to regular users, while getting caffeine was worth only $0.38.
28 days · lemon soft drink · 99 adults aged 18–30
Same sweet drink. One with caffeine, at cola level.
per person, per day. The caffeine group also liked the drink slightly more: 6.3 v. 6.0 on a nine-point scale.
Randomised trial · 99 adult daily caffeine consumers · lemon-flavoured drink, not a commercial cola (Keast et al., 2015).
One possible loop
One possible loop: how caffeine can reinforce a habit
- a sweet drink, caffeine you cannot taste
- a lift
- liking grows
- missing it after 12–24 h
- the same drink again
And the sugar?
Is sugar addictive too?
In the cited trial: sugar made it taste good, caffeine made people drink more. Why would a scientist be careful with the word “addictive”?
From one molecule to a crystal
Billions of billions of molecules, packed in order
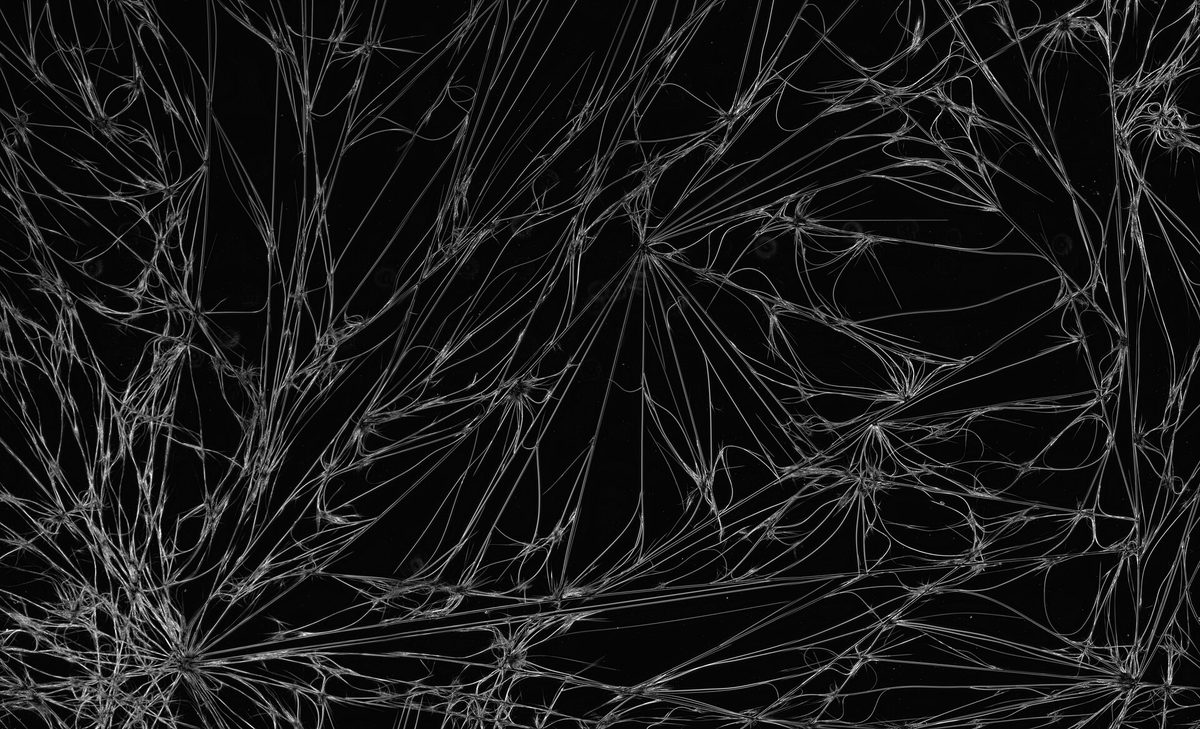
Real caffeine crystals under a dark-field microscope. Under crossed polarisers, on a laptop LCD screen, they light up in colour.
Dark-field photograph; the polarised-light demonstration is a separate classroom experiment. Photo: Zephyris, Wikimedia Commons, CC BY-SA 3.0
Homework
Find a drink that tells you its caffeine.
Copy the number and the volume, work out the caffeine per container, and bring the label wording to the next lesson.
The 45-minute core lesson, minute by minute (no IR instrument needed)
For students aged about 14–18 or first-year undergraduates.
- Each stage lists the props, what is on the screen, what to say, what students do, the answers to expect and the answer to give.
- It works with the single-colour engraved model and with colour + engraved.
- This lesson is for everyday teaching: it is not one of the controlled studies in our research article, although we would love to hear how it went.
00:00–02:00The case opens
- Props
- 2–3 coffee cups and the energy-drink can on the front of the desk. Models stay hidden.
- Screen
- Slide 2: “What do all of these have in common?”
- Say
- “Before we open a book: look at the desk. What do all of these have in common?”
- Students
- Call out ideas; you collect them without judging.
- Expect
- “Drinks”, “they wake you up”, “caffeine”, brand names (keep brands covered).
- Your move
- “Keep those answers. In 40 minutes we will know which of them is chemistry.”
02:00–04:00First guess
- Props
- Board and marker; worksheet box 1.
- Screen
- Slide 3.
- Say
- “Which chemical do you link with coffee and energy drinks?”
- Students
- Write their guess in box 1, then share.
- Expect
- Caffeine; sometimes sugar or taurine for the energy drink.
- Your move
- Write caffeine on the board and circle it. “Good. Now let’s test what you think you know about it.”
04:00–07:00Exhibit A: the blind smell test
- Props
- Jars 1–4, closed, in the teacher’s hands only. Smelling is voluntary: anyone may decline without giving a reason and record the results instead.
- Screen
- Slide 4: four numbered jars.
- Say
- “Two of these jars hold things you know, ground coffee and an energy drink, and both contain caffeine. One holds pure caffeine dissolved in water, about as much per litre as the energy drink. One holds only water. Which two jars will smell exactly alike? Predict first, then write what you smell for each number.”
- Then: “Coffee and the energy drink both contain caffeine. So why do they smell so different?”
- Students
- Predict first, then smell from a distance and write a word for each jar in box 2. Last question: “Which jar holds only caffeine dissolved in water?”
Lecture hall: three to five volunteers at the desk smell and call out; the hall records the predictions and the volunteers’ words. - Expect
- Jars 3 and 4 both marked “nothing”; guesses between them split roughly by chance. Some students expect caffeine to smell like coffee.
- Your move
- Collect hypotheses on the board. Do not give the answer yet.
The teacher holds each numbered jar in turn, lifts the lid briefly about 20 cm from the students and wafts the air towards them; nobody sniffs from the jar or touches its contents.
Predict it yourself: which two jars will smell exactly alike?
Tap every jar you expect to smell of something (the two you leave untapped are your “exactly alike” pair), then press Reveal. Run exactly this prediction with the class before the jars are opened.
07:00–10:00Exhibit A: the reveal
- Props
- Turn the jars over to show the labels; hold up the sealed vial of white solid.
- Screen
- Slide 5: the four jars revealed one by one; jar 3 smells the same as jar 4.
- Say
- “This white powder is pure caffeine. It is what I dissolved in jar 3, about as much as in the energy drink. Who could tell jar 3 from the water in jar 4?”
- Students
- Compare their notes for jars 3 and 4.
- Expect
- Surprise: “then what makes coffee smell?”
- Your move
- “Caffeine is one substance, and it has no smell. Coffee is a mixture of many compounds, and some of them carry the aroma. Same molecule in two drinks, completely different smells.” Write substance and mixture on the board.
Jar 2 · energy drink
About 0.3 g of caffeine per litre, plus everything else in the can.
Smells strongly.
Jar 3 · caffeine solution
About the same caffeine per litre, and nothing else.
Should smell of nothing, like the water in jar 4.
- The science: pure caffeine is odourless (PubChem, citing the Merck Index).
- The water jar is what makes it evidence rather than an impression, a small lesson in why scientists use controls.
- The aroma of coffee comes from a complex mixture of many other compounds (Sunarharum, Williams & Smyth, 2014).
10:00–14:00Exhibit B: read the label
- Props
- The can, passed round (closed); the coffee cups.
- Screen
- Slides 6 and 7: the EU rule, then the sum revealed step by step; then the label calculator with the numbers from the can.
- Say
- “Find the words ‘high caffeine content’ and the number next to them. How much caffeine is in the whole can?” Then: “Now find the same number on the coffee cup.”
- Students
- Read mg per 100 ml, calculate mg per can in box 3, look for a number on the cup.
- Expect
- About 75–80 mg for a 250 ml can; “the cup doesn’t say”.
- Your move
- “So which contains more caffeine, the can or the cup? The can declares its amount; the cup may not tell you how much caffeine your serving contains. In one study a single coffee-shop serving held anywhere from 58 to 259 mg: less than the can, or more than three times as much, and usually more than the can.”
- The science: in the EU, drinks other than coffee and tea with more than 150 mg of caffeine per litre must carry the words “High caffeine content. Not recommended for children or pregnant or breast-feeding women”, followed by the caffeine content in mg per 100 ml (Regulation (EU) No 1169/2011, Annex III, point 4.1).
- Typical energy drinks contain about 300–320 mg per litre (EFSA Panel on Dietetic Products, Nutrition and Allergies, 2015).
- In one study of coffee-shop coffee, caffeine ranged from 58 to 259 mg per serving, and the same drink bought from the same shop on six consecutive days ranged from 259 to 564 mg (McCusker, Goldberger & Cone, 2003).
Label calculator: from the number on the can to molecules
Type the numbers printed on a real can. The starting values are only an example in the typical range quoted above.
- Molar mass of caffeine 194.19 g/mol; Avogadro constant 6.022 × 10²³ mol−1.
- The body-weight line uses a hypothetical student, not anyone’s own weight, and the 3 mg per kg per day that EFSA suggested as a basis for children and adolescents (EFSA Panel on Dietetic Products, Nutrition and Allergies, 2015).
- That figure is a reference level from a safety assessment, not an amount anyone should aim to consume.
- A teaching calculation, not personal advice.
14:00–18:00Exhibit C: the molecule in your hands
- Props
- One engraved model per pair, handed out now.
- Screen
- Slide 8: the numbers after C, H, N and O appear one press at a time.
- Say
- “This is one caffeine molecule, many millions of times bigger than the real one. Read the letters, count the atoms and write the formula.”
- Students
- Count by element in box 4 and check each other.
- Expect
- Hydrogens miscounted (some sit behind other atoms); C8H10N4O2 after checking.
- Your move
- Reveal the last line of slide 8: 24 atoms. “Which hydrogens did you miss? Turn the model to find them.”
18:00–23:00Exhibit C: rotate to reveal
- Props
- The models; worksheet box 5.
- Screen
- Slide 9: the same model from the front and from behind.
- Say
- Three levels. “
- 1. Recall: partner A holds the model with its plain back towards partner B; B names every atom possible from its position and bonds.
- 2. Turn and search: turn it round. About 18 of the 24 letters face you from the front; turn and tilt the model to find the other six.
- 3. Verify: read every letter and score yourself.
- Then swap.”
- Students
- Name, turn, check, score themselves in box 5, swap roles.
- Expect
- Carbons and oxygens named well, nitrogens confused with carbons, hydrogens easy.
- Your move
- “What helped you name a nitrogen without its letter? Count its bonds.”
23:00–26:00Exhibit C: 3D meets 2D
- Props
- 2D structure printouts, one per pair; models.
- Screen
- Slide 10: the 2D structure. For a bigger picture, switch to the viewer in Flat 2D.
- Say
- “Put the model next to the drawing. Find the four nitrogens, the two C=O double bonds and the two rings. Which ring has five atoms, which has six?”
- Students
- Point on both, mark on the printout, answer in box 6.
- Expect
- Hydrogens missing on the drawing confuse some students.
- Your move
- “Chemists leave the hydrogens on carbon out of drawings. Where are they on your model?”
26:00–34:00Exhibit D: the spectra, on the big screen
- Props
- The models stay on the desks; the viewer in full screen on the projector, Flat 2D, Atom Labels on.
- Screen
- Slide 11 for the three questions; for each answer press its Show it live button. The slides close, the live viewer opens in full screen on that spectrum, lying flat. Click the bands and atoms there; press Esc and return to the slides.
- Say
- If time is short, do IR and ¹H NMR live and leave the mass spectrum for box 7 of the worksheet. “Chemists do not identify a molecule by looking at it. They measure it. Three challenges: answer first, then we look.” After each vote, open the spectrum: IR and click the band at 1686 cm−1; ¹H NMR in DMSO-d6; the mass spectrum.
- Students
- Vote and write each answer in box 7, then find the same groups on the model in their hands: the two C=O groups, the three methyl groups and the lone ring hydrogen.
- Expect
- “One peak for each bond” for IR; “ten signals” for NMR.
- Ages 14–16
- Show only the mass spectrum: the peak at m/z 194 is the whole molecule, and its mass matches the formula students counted on the model. Keep IR and NMR for older students or for the infrared extension.
- Your move
- “A band belongs to a vibration of the whole molecule, so read it as where the C=O groups contribute most.
- Equivalent hydrogens share one signal.
- The peak at m/z 194 is the molecular ion, M+·: the whole molecule with one electron removed. Its nominal mass, 194, is consistent with the molar mass of C8H10N4O2, 194.19 g/mol.”
- Questions for every spectrum are in the spectra gallery.
34:00–37:00The evidence board
- Screen
- Best live: press Show it live on slide 12 to open the viewer in All in one mode, all ten caffeine spectra on one screen, and click through them. If the network fails, slide 12 itself reveals the three spectrum pictures one by one.
- Say
- “Would one peak be enough to identify caffeine?”
- Expect
- “Yes, the 194.” Many molecules share a mass, a group or a signal.
- Your move
- “IR tells you which groups are there, NMR in what surroundings the atoms sit, mass spectrometry how heavy the molecule is. None of them alone is proof; together they point to one molecule.”
37:00–41:00Models away
- Props
- Collect the models into the box.
- Screen
- Slide 13: four questions.
- Say
- “Models away. Answer from memory, on your own.”
- Students
- Answer the four questions in box 8, then sketch caffeine from memory: the two rings, where the nitrogens and the oxygens sit. Not a perfect drawing, just the layout.
- Expect
- See the answer key.
- Your move
- Go through the answers together; ask a student who skipped the smell test to explain jar 3.
41:00–45:00The verdict
- Props
- Back to the cups and the can.
- Screen
- Slide 14: the verdict, revealed line by line.
- Say
- “Case 58-08-2: what is in your cup, one chemical or a whole world of molecules? Look at your first guess and how sure you were. Has it changed? Write your verdict: our conclusion is… because… one limitation is…”
- Students
- Write the verdict in box 9; two or three read theirs out.
- Expect
- “Caffeine doesn’t smell”, “coffee is a mixture”, “the can has to tell you”.
- Your move
- Point back to the answers from minute one: “Which of these turned out to be chemistry?” Set the homework: press End to jump to the last slide, skipping the extension slides.
Stretch task for older students
The molar mass of caffeine is about 194.19 g/mol. How many caffeine molecules are in 80 mg? (About 4.1 × 10⁻⁴ mol, or roughly 2.5 × 10²⁰ molecules: a quarter of a thousand billion billion copies of the object in their hand.) The label calculator does the same sum for any can.
Student worksheet
One per student. Press Print to get only the worksheet and the test; the rest of the page is left out.
The Chemistry of Coffee · worksheet
Name: ______________________ Date: __________
- First guess. Which molecule do coffee and energy drinks have in common? ______________________ How sure are you? 1 2 3 4 5
- Smell test. Jar 1: ________ Jar 2: ________ Jar 3: ________ Jar 4: ________ I think jar ____ holds only caffeine dissolved in water
- Label. ____ mg per 100 ml × ____ ml ÷ 100 = ____ mg in the can. Does the coffee cup give a number? yes / no
- Count the atoms. C ____ H ____ N ____ O ____ Formula: ______________ Total atoms: ____
- Rotate to reveal. Atoms I named correctly from the back: ____ out of 24. The hardest element to name was ____
- 3D meets 2D. The ring with five atoms contains ____ nitrogens; the ring with six atoms contains ____ nitrogens.
- Exhibit D. Which groups give the strongest IR bands? ____________ Why four ¹H NMR signals for ten hydrogens? ____________ Which peak is the molecular ion (the whole molecule)? ____
- From memory. Sketch the two rings and mark N and O:(a) Formula: __________ (b) Why does caffeine not smell of coffee? __________________________ (c) Why does the can carry a warning and the cup not? __________________________ (d) Coffee is a substance / a mixture
- The verdict. Our conclusion is ______________________ because ______________________. One limitation is ______________________. How sure am I now? 1 2 3 4 5
Five-question test (+3 extension questions) · before and after the lesson
Optional, and not counted in the 45 minutes: allow 3–5 minutes before the lesson and 3–5 after it, or give the second test at the start of the next lesson. Tick one answer.
- The formula of caffeine is ☐ C6H12O6 ☐ C8H10N4O2 ☐ C2H5OH
- Pure caffeine ☐ smells of coffee ☐ smells sweet ☐ has no smell
- A cup of coffee is ☐ one substance ☐ a mixture of many substances
- How many nitrogen atoms are in one caffeine molecule? ☐ 1 ☐ 2 ☐ 4
- In the EU, which must state its caffeine content on the label when it has more than 150 mg per litre? ☐ an energy drink ☐ coffee
Extension questions (ages 17+ and undergraduates; answer in two or three sentences):
- All four nitrogen atoms in caffeine are the same element. Why are they not all equivalent? ______________________________
- Caffeine has two C=O groups in the same ring system. Why should the strong bands in its carbonyl region not be read as “one peak for each C=O bond”? ______________________________
- Why does a caffeine crystal change polarised light in a way that one isolated caffeine molecule cannot? ______________________________
Key Answer key for the teacherworksheet boxes 2–9 and all eight test questions
- Box 2: jars 1 and 2 smell; jars 3 and 4 smell exactly alike (of nothing); jar 3 holds the caffeine dissolved in water.
- Box 3: for the example label, 32 × 250 ÷ 100 = 80 mg; a coffee cup usually gives no number.
- Box 4: C 8, H 10, N 4, O 2; C8H10N4O2; 24 atoms.
- Box 5: any score; about 18 of the 24 letters can be read from the front, the other 6 need turning.
- Box 6: the five-membered ring contains two nitrogens, the six-membered ring contains two nitrogens; the two rings share two carbon atoms.
- Box 7: the two C=O groups; three methyl groups of three equivalent hydrogens plus one ring hydrogen give four signals; the molecular-ion peak, M+· at m/z 194.
- Box 8: (a) C8H10N4O2; (b) pure caffeine is odourless, and the aroma of coffee comes from many other compounds in the mixture; (c) EU law requires the warning and the amount on drinks other than coffee and tea with more than 150 mg per litre; (d) a mixture.
- Box 9: for example: “Coffee is a mixture of many compounds because caffeine itself has no smell, yet coffee smells strongly. One limitation: we smelled only one concentration of caffeine.”
- Test: 1 C8H10N4O2; 2 has no smell; 3 a mixture; 4 four; 5 an energy drink.
- Question 6: their surroundings differ. Three nitrogens each carry a methyl group (N1, N3, N7); the fourth (N9) has no methyl and forms a double bond to carbon in the five-membered ring. Different neighbours and bonds give different chemical environments, which is also why they appear differently in spectra.
- Question 7: a band belongs to a vibration of the whole molecule in which several atoms move at once; the two C=O groups sit in one ring system, so the carbonyl region shows where the C=O groups contribute most, not one band per bond.
- Question 8: in a crystal very many molecules are packed in a regular, ordered pattern. Crystals that are not cubic split light into two parts travelling at different speeds (birefringence); this comes from the ordered packing, a property no single molecule has.
Homework
Find one drink at home or in a shop that states its caffeine content. Copy the number and the volume, work out the caffeine per container, and bring the answer, with the label wording, to the next lesson.
If a student cannot smell, or prefers not to
They act as the class recorders for the smell test, tallying the votes for each jar on the board. The result is the same lesson: jar 3 and jar 4 are indistinguishable.
Optional extensions and extra material
The 45-minute lesson above is complete on its own. Everything below is optional: open only what you need.
+15 minOptional 15-minute extension: the hidden ingredient, or why is caffeine in cola?
Caffeine in cola: can people taste it, and does it change what they choose?
For older students and undergraduates. Not part of the 45- or 60-minute plans: add it as a second lesson or replace another module, so the session does not grow to 75 minutes.
Coffee and energy drinks are bought for their caffeine.
- Cola is bought for its taste, yet caffeine is added to it too: in one study, to about 70% of the soft drinks consumed in the United States.
- Manufacturers have justified adding it as a flavouring (Griffiths & Vernotica, 2000).
Researchers have tested that claim directly, and what they found turns a can of cola into one of the most interesting objects in the lesson: a lesson about habits that we build without noticing.
Can anyone taste it?
Twenty-five adults who regularly drink cola tried colas with and without caffeine in a double-blind test. At about 0.1 mg per ml, the concentration in most cola products, only 2 of them (8%) could reliably tell the difference, and the group as a whole scored 53%, no better than guessing (Griffiths & Vernotica, 2000).
Not even trained tasters
Thirty trained tasters completed more than 1,600 discrimination tests. They could pick out caffeine dissolved in sweetened water at concentrations below those in cola, but when the same caffeine was added to a caffeine-free cola, every one of them failed to tell the drinks apart (Keast & Riddell, 2007).
But people drink more of it
- In a randomised controlled trial, 99 adults aged 18–30 who drank caffeine daily were blindly given a lemon-flavoured sweetened drink, not a commercial cola, with or without caffeine at the level found in cola (110 mg per litre).
- After nine days of 600 ml a day, they could drink as much as they liked for 28 days.
- The caffeine group drank on average 419 ml a day and the other group 273 ml, a statistically significant difference, and liked the drink slightly more.
- A trained panel of 30 tasters could not tell the two drinks apart (Keast, Swinburn, Sayompark, Whitelock & Riddell, 2015).
How can an ingredient you cannot taste change what you choose? Caffeine acts on the brain.
- When habitual caffeine consumers had a new drink paired with 100 mg of caffeine, they came to like its smell and flavour more than when it was paired with a placebo (Yeomans, Mobini & Chambers, 2007).
- And regular consumers who stop get real withdrawal symptoms: headache, fatigue, low mood and difficulty concentrating, typically starting 12–24 hours after the last dose and lasting 2–9 days; abstaining from as little as 100 mg a day produced symptoms (Juliano & Griffiths, 2004).
Put together, the research describes one possible loop. Not everyone goes through it, and not in the same way:
1
A sweet drink
with caffeine you cannot taste
2
A lift
caffeine acts on the brain
3
Liking grows
for the flavour paired with it
4
Missing it
withdrawal after 12–24 hours
5
The same drink again
and the loop closes
- The first team concluded that the high consumption of caffeinated soft drinks more likely reflects caffeine’s mood-altering and dependence-producing effects than its subtle effects as a flavouring (Griffiths & Vernotica, 2000).
- The second concluded that caffeine has no flavour activity in soft drinks, yet induces a physiological and psychological desire to consume the drink (Keast & Riddell, 2007).
- Some caffeine users do become dependent and are unable to cut down despite knowing that it causes them recurrent health problems; caffeine use disorder is listed as a condition for further study in the DSM-5 (Meredith, Juliano, Hughes & Griffiths, 2013).
Taste is not the same as choice
The research on caffeine in soft drinks asks three different questions, and it matters which one a study measured:
Question 1 · sensory detection
Can you taste it?
Blind taste tests: 2 of 25 cola drinkers, 0 of 30 trained tasters.
Question 2 · self-administration
Do you choose it?
Blind choice studies: do people repeatedly pick the drink that contains it?
Question 3 · reinforcement and withdrawal
Why do you choose it?
For its positive effects, to avoid withdrawal, or both?
The scientific question behind all three: can a substance influence behaviour even when its presence is not detected by taste?
Do people choose it? Blind choice studies
The taste tests asked whether people notice caffeine in cola. Choice studies ask whether they pick it.
- In a double-blind design, regular drinkers spent one day with caffeine-free cola and one day with caffeinated cola (33 mg per 8 oz serving), in random order, and then had unlimited access to both for one or two days.
- Nobody was told which was which, and the trial was repeated for six weeks (Liguori, Hughes & Oliveto, 1997a).
Cola-only drinkers
8 adults whose caffeine came only from cola, on average 157 mg a day (Liguori, Hughes & Oliveto, 1997a).
Cola and coffee drinkers
16 adults who drank cola and coffee, on average 579 mg a day. On caffeine-free cola alone they reported more drowsiness, fatigue and headache (Liguori, Hughes & Oliveto, 1997a).
A separate study: cola and coffee
11 adults averaging 632 mg a day, tested in four conditions (cola or coffee, 33 or 100 mg per serving), six double-blind weekly trials each: 24 weeks. Not a choice between two colas only (Liguori & Hughes, 1997b).
Read it honestly: these are small groups of adult, regular caffeine users, so the numbers are not an estimate for all cola drinkers. What they show is that caffeine can reinforce repeated choice of a drink in some users, without anyone knowing which drink contained it. Caffeine did not win everyone over.
Why pick it? Mostly to avoid feeling worse
A separate caffeine-withdrawal experiment, not a cola test.
- Moderate caffeine consumers (on average 379 mg a day), abstinent overnight, would give up an average of $2.51 to avoid getting placebo again, while choosing caffeine over only $0.38.
- The authors concluded that choosing caffeine was more strongly driven by avoiding withdrawal than by its positive effects (Schuh & Griffiths, 1997).
Dependence doubles the pull
When the same people had been taking caffeine daily, they chose caffeine over placebo twice as often as after a period on placebo (Garrett & Griffiths, 1998).
A new taste, learned in four mornings
After a night without caffeine, liking for an unfamiliar fruit tea rose over four breakfasts when it contained caffeine, and fell when it did not (Yeomans, Spetch & Rogers, 1998).
Put plainly
The flavour explanation does not survive the test.
- At cola concentrations almost nobody can taste caffeine.
- The effects the studies did measure are that people drink more of the same drink, like it more, and get withdrawal symptoms when they stop (Griffiths & Vernotica, 2000; Keast & Riddell, 2007; Keast, Swinburn, Sayompark, Whitelock & Riddell, 2015; Juliano & Griffiths, 2004).
And the sugar?
Sugar is the other half of the drink, and here the evidence is more mixed than headlines suggest. That makes it a good lesson in itself: science does not always give the answer we expect.
In rats
With intermittent access to sugar, rats binge on it and show signs of withdrawal and craving, together with brain changes also seen with addictive drugs (Avena, Rada & Hoebel, 2008).
- After repeated, excessive sugar intake, a drug that blocks opioids produced behavioural and neurochemical signs of opioid withdrawal (Colantuoni et al., 2002).
In people
A review of the animal and human research found little evidence for sugar addiction in humans.
- Binge-like behaviour seems to come from intermittent access to sweet, highly palatable food rather than from sugar’s effects on the brain, and the authors argue against using “sugar addiction” in public policy yet (Westwater, Fletcher & Ziauddeen, 2016).
What has been measured is the combination.
- In the cited randomised trial, people given the drink with a cola-level dose of caffeine drank more of it than people given the same drink without caffeine, 419 v. 273 ml a day, and liked it slightly more (Keast, Swinburn, Sayompark, Whitelock & Riddell, 2015).
- Ask the class: “A scientist is careful with the word ‘addictive’ for both. Why is the evidence for caffeine dependence and withdrawal stronger than for sugar?”
What the research shows
- At cola concentrations, almost nobody can taste the caffeine.
- Caffeine makes people like the flavour it comes with.
- With caffeine added, people drank more of the same sweet drink.
- Regular users who stop get withdrawal symptoms.
What it does not show
- What any company intends: none of these studies measured that.
- That one can makes anyone addicted.
- Anything about one brand: the studies tested cola drinks in general.
Teach the evidence, and let students draw the line between a finding and an accusation.
+0–3 minCan you taste it?
- Props
- The coffee cup, the energy-drink can and a can of cola, all brands covered.
- Screen
- Slide 15 (“Why is it in cola?”), then slide 16 (dots light up on the press).
- Say
- “All three contain caffeine. Manufacturers have described caffeine as a flavouring ingredient. Can people actually taste it in cola? How would you test that?” Take two or three designs, then reveal: 2 of 25 regular cola drinkers, 0 of 30 trained tasters.
- Expect
- “Blind tasting, two cups.” Push for double-blind and many repeats.
+3–6 minDo you choose it?
- Screen
- Slides 17 and 18: three questions, then the blind choice results.
- Say
- “If you cannot taste it, can you still keep choosing the drink that contains it?” Reveal the three groups one by one, with their size.
- Your move
- “Small groups of adults who already drink a lot of caffeine. So this tells us it can happen, not how often it happens to everyone.”
+6–10 minWhat happens to consumption?
- Screen
- Slide 19: 419 against 273 ml a day.
- Say
- “Same lemon drink, caffeine at cola level, tasters could not tell them apart. Who drank more?”
- Expect
- “So it’s addictive?” Hold that question for the last step.
+10–13 minReward, or avoiding withdrawal?
- Screen
- Slide 20: the loop, step by step.
- Say
- “In a separate experiment, regular users would give up $2.51 to avoid placebo, but accept only $0.38 instead of caffeine. What does that tell you about why people choose it?”
- Your move
- Name the two mechanisms: positive effects, and relief from withdrawal (headache, tiredness after 12–24 hours).
+13–15 minWhat the research proves, and what it does not
- Screen
- Slide 21 (sugar) and the two columns on this page.
- Say
- “What has been shown? What has not been shown? A scientist is careful with ‘addictive’ for both: why is the caffeine evidence stronger?”
- Your move
- Finish with the cola can: about 100 mg of caffeine per litre is below the 150 mg line for the EU warning, so a drink can contain caffeine without a warning and without tasting of it. Read the real can.
Tone. Many students drink cola every day. The aim is not to frighten or to blame, but to show how science tests a claim and how a habit can form below the level of taste. The EU warning threshold is from Regulation (EU) No 1169/2011; caffeine content varies between products and countries, so always read the actual can.
+15 minOptional extension: from one molecule to a crystal (15 minutes, or the next lesson)
From one molecule to a crystal: dissolve, cool, and watch crystals light up under polarised light.
The model in the students’ hands is one molecule.
- The white solid in the sealed vial is billions of billions of them (one can of energy drink alone holds about 2.5 × 10²⁰ caffeine molecules), and when they pack in order they form crystals that turn into small rainbows under polarised light.
- This module asks one question: is a crystal of caffeine one giant molecule? (No: it is an ordered arrangement of very many separate molecules.)
Before the lesson, in the prep room: grow the crystals
Caffeine is far more soluble in hot water than in cold.
- According to the Merck Index, 1 g dissolves in 46 ml of water at room temperature but in only 5.5 ml at 80 °C (PubChem, citing the Merck Index).
- Dissolve a small amount in hot water, cover the beaker and let it cool slowly and undisturbed; caffeine comes out of water as long, flexible, silky crystals (PubChem, citing Hawley’s Condensed Chemical Dictionary).
- Seal a few crystals under a cover glass or in a closed Petri dish for the lesson.
- No time or no prep room? A ready-made sealed preparation of caffeine crystals works just as well; the teacher then only has to bring it.
Students calculate first
“We dissolved 1 g in 5.5 ml of water at 80 °C and let it cool to room temperature. How much caffeine can no longer stay dissolved?” At room temperature 5.5 ml holds only about 0.12 g, so roughly 0.88 g, nearly nine tenths, has to come out of solution. (Ignoring the water that the crystals themselves can take up.)
Make a polarising light box from a laptop
An LCD screen of a laptop or tablet is a bright source of polarised light (Fakhruddin, 2008).
- OLED screens may not behave the same way, so test your own screen with the polarising film before the lesson.
- Lay the screen flat, show a plain white page at full brightness, put the sealed crystals on it and hold a sheet of polarising film above them.
- Turn the film until the white screen goes dark: the polarisers are now crossed.
The reveal
Against the dark background the crystals light up in colours. Turn the slide slowly and the colours shift; at certain angles a crystal goes dark. Point a phone camera through the film and put the image on the projector so the whole class sees it, or use a microscope with crossed polarisers and a camera if the school has one.
Why it happens
Crystals that are not cubic split light into two parts that travel at different speeds (birefringence); when the two recombine in the second polariser they interfere, and the colour depends on the crystal’s thickness and orientation.
- Caffeine qualifies: the crystal structures solved for its anhydrous forms are monoclinic and rhombohedral, not cubic (Lehmann & Stowasser, 2007; Enright, Terskikh, Brouwer & Ripmeester, 2007).
- Crystals grown from water can take up water and form a hydrate, a different solid form, so use these structures to explain why ordered crystals change light, not as a measurement of your own sample.
- The same molecules, packed in a regular pattern, change what light does: a property no single molecule has.
Back to the model
“Your model has 24 atoms. How many models would it take to build the crystal on the screen?” Use the stretch-task number: the 80 mg in one can already contains about 2.5 × 10²⁰ molecules.
How big can caffeine crystals grow?
- We have not found a reliable published maximum, and size depends strongly on how slowly the solution cools, how many seed crystals form and the surface they grow on.
- Rather than quote a number we cannot check, we will grow, photograph and measure our own caffeine crystals, including polarised-light images, and publish the method, the photographs and the sizes here.
+10–15 minOptional extension: from substance to spectrum (infrared, 10–15 minutes)
From substance to spectrum: which bonds the IR spectrum shows, read with the model in hand.
So far students have smelled caffeine (nothing), held its model (24 atoms) and seen its crystals (colours). Infrared spectroscopy adds the missing step of real chemistry: measure the substance with an instrument and let the data say what is inside.
- Bonds vibrate, and each kind of bond absorbs infrared light at its own characteristic wavenumbers.
- The resulting spectrum is a fingerprint of the substance, and FTIR with an ATR accessory has already been used to determine caffeine in coffee in a published teaching experiment and in soft drinks (Singh, Wechter, Hu & Lafontaine, 1998; Paradkar & Irudayaraj, 2002).
Know your instrument first
Most handheld and portable IR spectrometers measure by ATR: a few milligrams of powder must touch the measuring crystal and be pressed onto it as the manufacturer describes.
- It is not point-and-shoot.
- Check which accessory yours has, and let the teacher or a trained operator prepare and measure the sample from the prep-room caffeine, then clean the crystal as instructed.
Background, then sample
Record the empty-crystal background, then the caffeine.
- Put the live spectrum on the projector.
- Explain the axes: wavenumber in cm−1, increasing to the left by convention.
- On the vertical axis, check what your instrument shows: with absorbance, absorption bands point upwards; with transmittance, they point downwards. The MolGod viewer shows absorbance.
Open the same molecule in the viewer
In the viewer above, switch to its IR spectrum: hovering over a band lights up the atoms of the group that absorbs there, and clicking opens a card explaining it.
- The band-to-group assignments come from a published general FTIR correlation table of typical ranges, not from a caffeine-specific calculation (Pasieczna-Patkowska, Cichy & Flieger, 2025).
The model in the hand explains the peaks
In the gas-phase reference spectrum shown in our viewer, the two strongest bands lie at about 1686 and 1722 cm−1, in the region where C=O groups absorb (NIST Chemistry WebBook).
- “Find every C=O group on your model.”
- There are two: on the colour + engraved model both oxygens are red; on the single-colour model, find the O letters double-bonded to C.
- The students hold the groups that contribute most to the strongest bands they are looking at.
One peak is not one bond
Say this clearly, because the model makes the shortcut tempting.
- A band belongs to a vibration of the whole molecule, in which several atoms move at once; in caffeine the two C=O groups sit in the same ring system, so read the carbonyl region as “where the C=O groups contribute most”, not as “one peak for each C=O bond”.
- Working out exactly which atoms move in each band is the subject of computational studies (for example, Srivastava & Singh, 2013).
- The viewer highlights groups for the same reason.
Every spectrum has its own numbers
The reference spectrum in our viewer is caffeine in the gas phase, while the class measures a solid, and other published measurements report other band positions.
- Expect the same overall pattern, with bands shifted and broadened.
- Do not force all spectra into one table of numbers: read each spectrum’s own values and discuss why phase and technique move them.
- Solid-phase references exist, for example NIST’s diffuse-reflectance spectrum of solid caffeine (NIST Chemistry WebBook) and an open ATR-FTIR dataset of anhydrous caffeine powder (Abdull Manap, 2018); we plan to add solid-phase spectra to the viewer, each labelled with its phase and technique.
- To identify a sample properly, compare its whole spectrum with a reference measured the same way.
What IR can and cannot say
One band does not prove that a sample is caffeine, let alone that it is pure; the whole pattern does the work. Measuring how much caffeine a drink contains is possible with FTIR-ATR, but needs calibration and a validated method.
ProjectorNo instrument? Ten spectra ready for the projector
Ten reference spectra ready for the big screen, with what each one shows.
The caffeine page holds ten reference spectra: seven NMR records (¹H in three solvents, ¹³C in four records), an infrared spectrum, an electron-ionisation mass spectrum and a UV-Vis spectrum, each with its source.
- Every spectrum is drawn over the molecule itself.
- Pick one below to see what the class will see, with a question to ask; then open the same spectrum in the live viewer.
Ask the class: caffeine has ten hydrogen atoms. Why are there only four signals?
What the screen shows: ¹H NMR at 400 MHz in DMSO-d6, signals at 7.99, 3.87, 3.39 and 3.20 ppm. Each signal has its own colour, and the same colour rings the hydrogens that produce it: three methyl groups of three equivalent hydrogens each (heights 3H) and one lone hydrogen on the five-membered ring (1H). Students can find all four groups on the model in their hand.
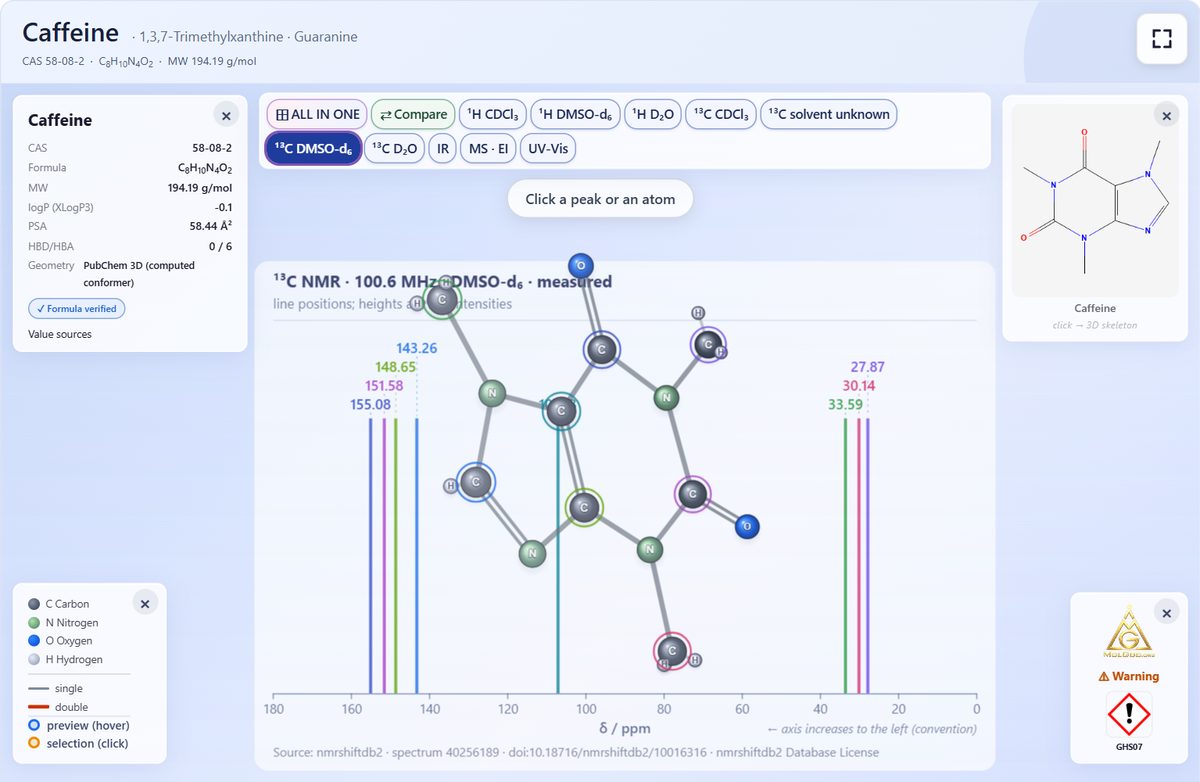
Ask the class: the ¹H spectrum had four signals for ten hydrogens. How many signals do you expect for eight carbons, and why?
What the screen shows: ¹³C NMR in DMSO-d6 with eight signals for eight carbon atoms. No two carbons in caffeine sit in the same environment, so none of them share a signal; the hydrogens in each methyl group do.
Ask the class: the strongest band is selected. Find the atoms that light up on the screen, then find the same groups on your model.
What the screen shows: the gas-phase IR spectrum (NIST) with the strongest band, 1686 cm−1, clicked. Both C=O groups light up and a card opens; see the infrared module for how to read it honestly.
Ask the class: work out the molar mass of C8H10N4O2 from the model (count the atoms). Which peak is the whole molecule?
What the screen shows: the electron-ionisation mass spectrum (NIST) with the molecular ion at m/z 194, marked M+·, and labelled fragments at 42, 55, 67, 82, 109, 137 and 165; the molecular ion at 194 is also the strongest peak of all, and the strongest fragment is at 109. A good follow-up: 194 − 109 = 85. The model cannot show how the molecule breaks, and the spectrum cannot show its shape; together they say more than either alone.
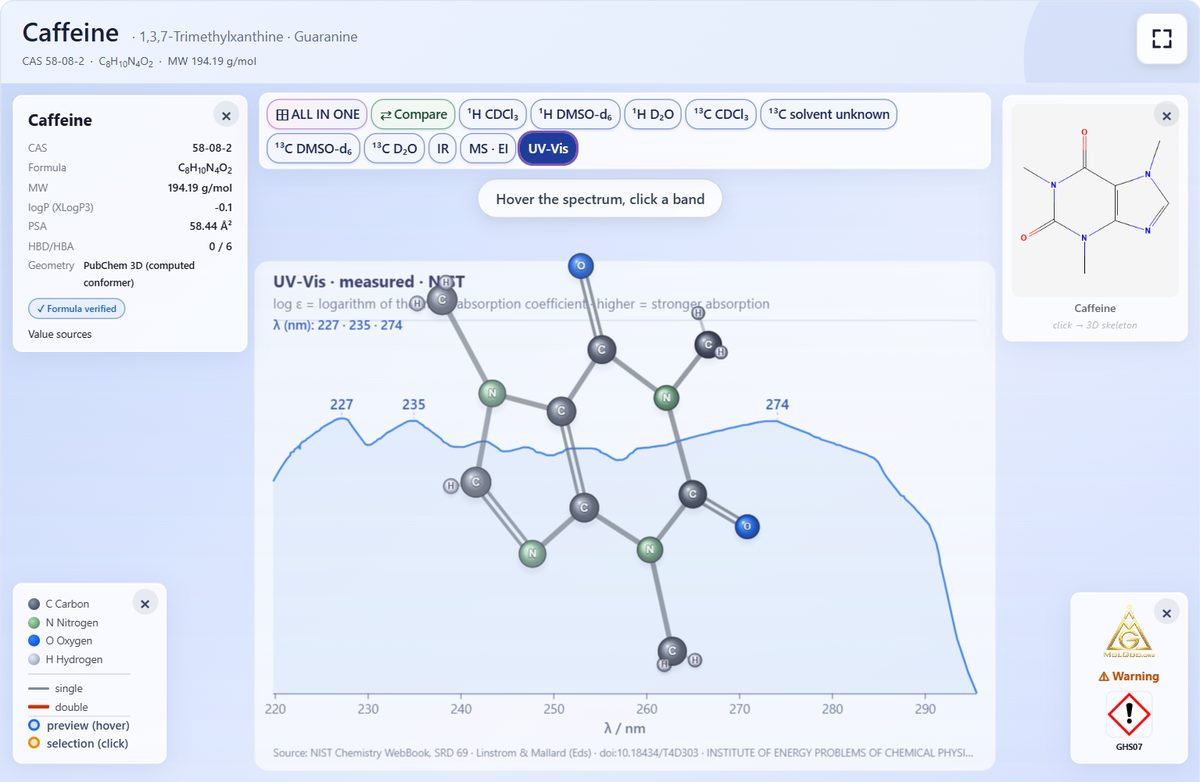
Ask the class: caffeine absorbs light strongly here. So why is the solid in the sealed vial white?
What the screen shows: a UV-Vis spectrum from the NIST Chemistry WebBook, originally published by Florentin and Heros in 1947, with maxima at 227, 235 and 274 nm, plotted as log ε. All of them lie in the ultraviolet, well below about 400 nm where visible light begins, which is why our eyes see no colour.
Ask the class: the three ¹H spectra were measured in three different solvents. Is the lone ring hydrogen always at the same place?
What the screen shows: All in one mode, every spectrum on one screen. The ring hydrogen sits at 7.53 ppm in CDCl3, 7.99 in DMSO-d6 and 7.88 in D2O: the same molecule, three sets of numbers. It is the NMR version of the lesson from infrared: every spectrum has its own numbers, so always read the conditions.
Coming nextComing next: the molecular evidence cube
The molecular evidence cube: one face per technique.
The model in the hand shows what caffeine looks like. The instruments show how chemists know what it looks like. We are preparing a single object that holds both: a clear glass block with the caffeine molecule engraved inside it by a laser, and real caffeine data on three of its faces.
- Subsurface laser engraving focuses a laser at points deep inside the glass, so the molecule appears as a three-dimensional image made of thousands of tiny points, floating in the block; the surface stays smooth.
- It is a display and teaching object, not a crystal of caffeine: the real crystals are the ones that glow under polarised light.
The faces carry the same data that is already in our viewer:
Infrared face
The reference IR spectrum, with the region where the C=O groups contribute most marked (NIST Chemistry WebBook). Turn the cube: where are the groups that contribute most to the strongest bands? Point to both C=O groups inside the glass.
NMR face
¹H: four signals, at 3.20, 3.39, 3.87 and 7.99 ppm (DMSO-d6, 400 MHz); ¹³C: eight signals for eight carbon atoms (nmrshiftdb2; Steinbeck & Kuhn, 2004). Turn the cube: ten hydrogens, four signals. Why? Three methyl groups plus one lone ring hydrogen.
EI mass-spectrum face
The strongest peak at m/z 194, the whole molecule, and the strongest fragment at m/z 109 (NIST Mass Spectrometry Data Center). Turn the cube: why a big peak at m/z 194? It is the molecular ion, M+·, with a nominal mass of 194, consistent with the molar mass of C8H10N4O2, 194.19 g/mol.
- Every face states what a scientist needs to trust it: the phase of the sample, the technique, the source with its identifier or DOI, and whether the spectrum was normalised.
- The mass spectrum is an electron-ionisation (EI) reference spectrum, not a GC-MS measurement, and is labelled as such.
- The top and bottom carry the name, formula, CAS number and InChIKey, with a QR code to the caffeine page.
- Each method answers a different question: IR tells you which groups are there, NMR in what environments the hydrogen and carbon atoms sit, and mass spectrometry how heavy the molecule is and how it breaks.
- None of them is a photograph of the molecule, and mass spectrometry says nothing about its shape.
- Holding all three around one molecule is the point.
- We will publish photographs as soon as the first prototype exists; the hypothesis it raises (H20) is in our research article.
60 minThe 60-minute extended science lesson: one substance, four ways of knowing it (needs an IR spectrometer and prepared crystals)
The extended version: one substance, four ways of knowing it, minute by minute.
With a double period or a university session, the modules join into one story. The 45-minute core lesson needs neither: the viewer replaces the live instrument, and the crystals are left out.
| Minutes | Stage | What students learn |
|---|---|---|
| 00–05 | Cups and can: the puzzle | caffeine is in everyday products |
| 05–12 | Blind smell test and reveal | substance versus mixture; why a control matters |
| 12–16 | Read the label | mg per 100 ml, mg per can; coffee varies |
| 16–24 | Meet the molecule, find the two C=O groups | formula, 24 atoms, the groups behind the strongest peaks |
| 24–36 | Live IR measurement and the viewer, model in hand | a real signal from a real sample; bonds vibrate |
| 36–42 | Rotate to reveal | retrieval: name, turn, check |
| 42–50 | Crystals under polarised light | many molecules in order behave differently from one |
| 50–56 | Models away: quiz | what stayed without the object |
| 56–60 | One sentence each | one substance, four ways of knowing it |
ResearchFive tips that come from published research
Five practical tips that come from published research on teaching with models.
These follow from research already published, not from our own hypotheses, and they work with any model:
Let students handle the model, even briefly
Three to five minutes with physical 3D-printed models made a measurable difference in the study by Boiangiu and colleagues (2025). That study tested physical models in general, not engraved ones.
If you use colour, put the key on the model, not on a sheet
A separate key splits attention between two sources (Chandler & Sweller, 1991); an engraved symbol is the key, on the atom.
Take the model away at the end
Ask students to draw the structure or name the atoms from memory: the skill has to work without the object.
Test, then check
Retrieving an answer strengthens memory more than re-reading it (Roediger & Karpicke, 2006): that is what “rotate to reveal” and “models away” do.
Only a single-colour printer?
Print the engraved version. Every MolGod molecule page offers a plain and an engraved model for free, and the teachers’ page collects the most useful ones.
Want the research behind it?
Read Colour, letters, or both? and take the 2-minute self-test it starts with.
For teachers and researchers
Run it, then tell us what happened
We are looking for chemistry teachers, lecturers and education researchers who would like to run this lesson or the studies behind it with their students. Teachers receive ready-to-print models free of charge. Write to pure@molgod.org.
Need a different molecule for your lesson? Send us its name or CAS number and we will prepare a printable model with engraved atoms; we confirm the timing for each substance.
Join the Research Partners pilot → Free models for teachers →
Author: Adrian Koska · MolGod.org · Published: 1 November 2026 · Companion to Colour, letters, or both? Four versions of the same molecule and the experiments that will tell them apart
Free to teach
How you may use this lesson
MolGod’s own lesson materials on this page (the lesson text, the minute-by-minute script, the slide texts, the worksheet, the test and the answer key) are licensed under Creative Commons Attribution-NonCommercial 4.0 International (CC BY-NC 4.0).
- You may teach with them, copy and share them with your students, put them on your school’s or university’s learning platform, and translate or adapt them, including the slides and worksheets,
- as long as you credit “Caffeine Lesson: All-in-One Kit, MolGod.org” with a link to this page, mark any changes, and do not use them commercially without our separate permission.
Not covered by this licence, and keeping their own terms:
- the MolGod 3D viewer, its interface and images or screenshots of the viewer (all rights reserved)
- MolGod safety data sheets (all rights reserved)
- MolGod 3D model files, which keep the licence stated on each model page: the molecule alone (NORMAL and ENGRAVED files) under CC BY-SA 4.0, the ready-to-print model on a base under CC BY-NC-SA 4.0
- and photographs, spectra and publications by others (the licence of their owners, as credited below).
Continue: everything connected to this lesson
MolGod Research Partners: one model per pair, with or without engraved symbols, a protocol and a report on your class.
Colour, letters, or both? Four versions of the same molecule, 20 hypotheses and the planned studies.
Find and name atoms on four versions of caffeine; good as a warm-up or homework.
Turn the engraved model on screen
Watch the readable letters fall from 18 of 24 at the front to none at the back.
The 3D viewer with ten spectra, data with sources, and the free printable models.
The engraved-model project: how the models are made and how we intend to test them.
More printable molecules for your class, plain and engraved.
Caffeine’s close relative, one methyl group fewer: a natural transfer test for your students.
Image credits
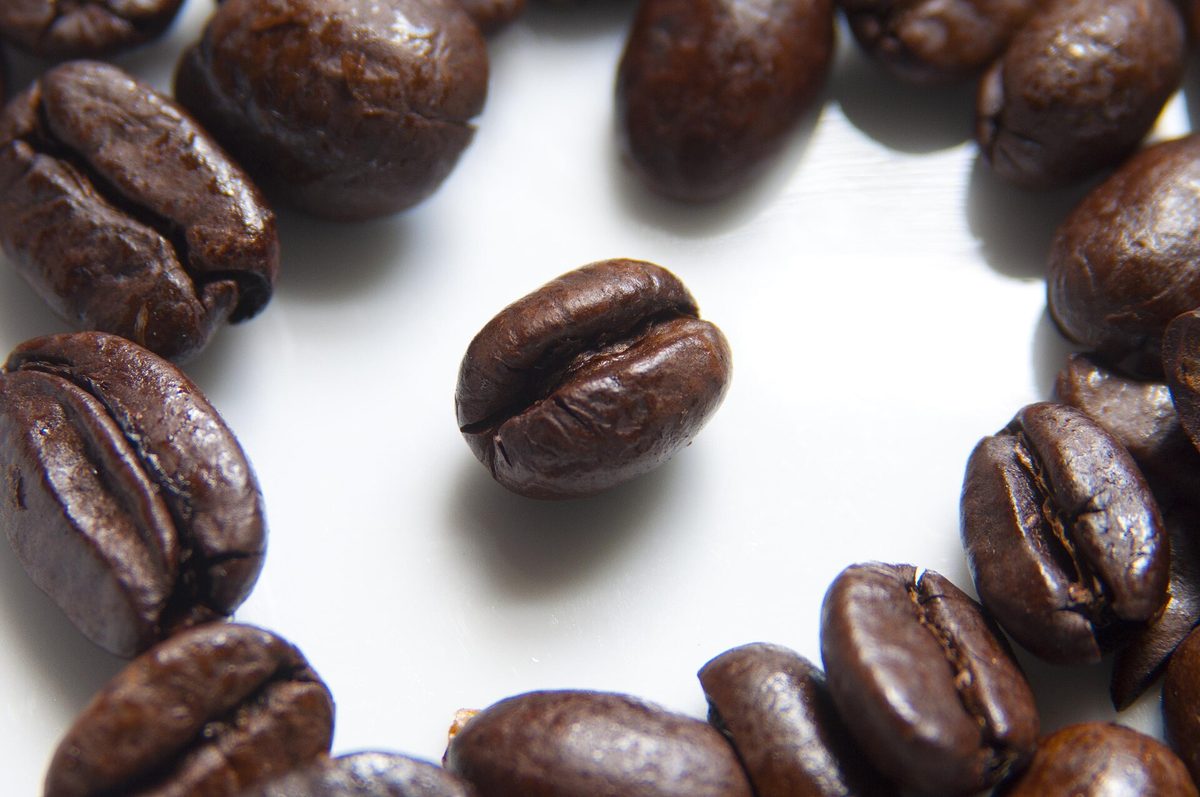
- Roasted coffee beans: Robert Knapp, Wikimedia Commons, CC BY-SA 3.0.
- Caffeine crystals, dark-field microscopy: Zephyris, Wikimedia Commons, CC BY-SA 3.0.
- Space-filling caffeine model: Jynto, Wikimedia Commons, CC0.
- All three are shown resized, not otherwise altered.
- The lineup of everyday caffeine products on the opening slide was supplied by MolGod as an illustration of everyday context, not as photographs of official packaging (use real labels for the label task); brand names in it identify everyday products only, and MolGod is not affiliated with, or endorsed by, these companies.
- Every other image on this page is by MolGod: photographs of our prints, renders of our print designs and screenshots of the MolGod viewer.


References
Peer-reviewed sources cited in this lesson, checked against their Crossref records on 31 October 2026.
- Avena, N. M., Rada, P., & Hoebel, B. G. (2008). Evidence for sugar addiction: Behavioral and neurochemical effects of intermittent, excessive sugar intake. Neuroscience & Biobehavioral Reviews, 32(1), 20–39. https://doi.org/10.1016/j.neubiorev.2007.04.019
- Boiangiu, R.-Ş., Popa, L. N., & Mihășan, M. (2025). Impact of 3D-printed molecular models on student understanding of macromolecular structures: A compensatory research study. Biochemistry and Molecular Biology Education, 53(4), 358–369. https://doi.org/10.1002/bmb.21902
- Chandler, P., & Sweller, J. (1991). Cognitive load theory and the format of instruction. Cognition and Instruction, 8(4), 293–332. https://doi.org/10.1207/s1532690xci0804_2
- Colantuoni, C., Rada, P., McCarthy, J., Patten, C., Avena, N. M., Chadeayne, A., & Hoebel, B. G. (2002). Evidence that intermittent, excessive sugar intake causes endogenous opioid dependence. Obesity Research, 10(6), 478–488. https://doi.org/10.1038/oby.2002.66
- Enright, G. D., Terskikh, V. V., Brouwer, D. H., & Ripmeester, J. A. (2007). The structure of two anhydrous polymorphs of caffeine from single-crystal diffraction and ultrahigh-field solid-state 13C NMR spectroscopy. Crystal Growth & Design, 7(8), 1406–1410. https://doi.org/10.1021/cg070291o
- Fakhruddin, H. (2008). Some activities with polarized light from a laptop LCD screen. The Physics Teacher, 46(4), 229–231. https://doi.org/10.1119/1.2895673
- Garrett, B. E., & Griffiths, R. R. (1998). Physical dependence increases the relative reinforcing effects of caffeine versus placebo. Psychopharmacology, 139(3), 195–202. https://doi.org/10.1007/s002130050704
- Griffiths, R. R., & Vernotica, E. M. (2000). Is caffeine a flavoring agent in cola soft drinks? Archives of Family Medicine, 9(8), 727–734. https://doi.org/10.1001/archfami.9.8.727
- Juliano, L. M., & Griffiths, R. R. (2004). A critical review of caffeine withdrawal: Empirical validation of symptoms and signs, incidence, severity, and associated features. Psychopharmacology, 176(1), 1–29. https://doi.org/10.1007/s00213-004-2000-x
- Keast, R. S. J., & Riddell, L. J. (2007). Caffeine as a flavor additive in soft-drinks. Appetite, 49(1), 255–259. https://doi.org/10.1016/j.appet.2006.11.003
- Keast, R. S. J., Swinburn, B. A., Sayompark, D., Whitelock, S., & Riddell, L. J. (2015). Caffeine increases sugar-sweetened beverage consumption in a free-living population: A randomised controlled trial. British Journal of Nutrition, 113(2), 366–371. https://doi.org/10.1017/S000711451400378X
- Lehmann, C. W., & Stowasser, F. (2007). The crystal structure of anhydrous β-caffeine as determined from X-ray powder-diffraction data. Chemistry – A European Journal, 13(10), 2908–2911. https://doi.org/10.1002/chem.200600973
- Liguori, A., Hughes, J. R., & Oliveto, A. H. (1997a). Caffeine self-administration in humans: 1. Efficacy of cola vehicle. Experimental and Clinical Psychopharmacology, 5(3), 286–294. https://doi.org/10.1037/1064-1297.5.3.286
- Liguori, A., & Hughes, J. R. (1997b). Caffeine self-administration in humans: 2. A within-subjects comparison of coffee and cola vehicles. Experimental and Clinical Psychopharmacology, 5(3), 295–303. https://doi.org/10.1037/1064-1297.5.3.295
- McCusker, R. R., Goldberger, B. A., & Cone, E. J. (2003). Caffeine content of specialty coffees. Journal of Analytical Toxicology, 27(7), 520–522. https://doi.org/10.1093/jat/27.7.520
- Meredith, S. E., Juliano, L. M., Hughes, J. R., & Griffiths, R. R. (2013). Caffeine use disorder: A comprehensive review and research agenda. Journal of Caffeine Research, 3(3), 114–130. https://doi.org/10.1089/jcr.2013.0016
- Paradkar, M. M., & Irudayaraj, J. (2002). Rapid determination of caffeine content in soft drinks using FTIR–ATR spectroscopy. Food Chemistry, 78(2), 261–266. https://doi.org/10.1016/S0308-8146(02)00116-4
- Pasieczna-Patkowska, S., Cichy, M., & Flieger, J. (2025). Application of Fourier transform infrared (FTIR) spectroscopy in characterization of green synthesized nanoparticles. Molecules, 30(3), 684. https://doi.org/10.3390/molecules30030684
- Roediger, H. L., & Karpicke, J. D. (2006). Test-enhanced learning: Taking memory tests improves long-term retention. Psychological Science, 17(3), 249–255. https://doi.org/10.1111/j.1467-9280.2006.01693.x
- Schuh, K. J., & Griffiths, R. R. (1997). Caffeine reinforcement: The role of withdrawal. Psychopharmacology, 130(4), 320–326. https://doi.org/10.1007/s002130050246
- Singh, B. R., Wechter, M. A., Hu, Y., & Lafontaine, C. (1998). Determination of caffeine content in coffee using Fourier transform infra-red spectroscopy in combination with attenuated total reflectance technique: A bioanalytical chemistry experiment for biochemists. Biochemical Education, 26(3), 243–247. https://doi.org/10.1016/S0307-4412(98)00078-8
- Srivastava, S. K., & Singh, V. B. (2013). Ab initio and DFT studies of the structure and vibrational spectra of anhydrous caffeine. Spectrochimica Acta Part A: Molecular and Biomolecular Spectroscopy, 115, 45–50. https://doi.org/10.1016/j.saa.2013.06.005
- Steinbeck, C., & Kuhn, S. (2004). NMRShiftDB – compound identification and structure elucidation support through a free community-built web database. Phytochemistry, 65(19), 2711–2717. https://doi.org/10.1016/j.phytochem.2004.08.027
- Sunarharum, W. B., Williams, D. J., & Smyth, H. E. (2014). Complexity of coffee flavor: A compositional and sensory perspective. Food Research International, 62, 315–325. https://doi.org/10.1016/j.foodres.2014.02.030
- Westwater, M. L., Fletcher, P. C., & Ziauddeen, H. (2016). Sugar addiction: The state of the science. European Journal of Nutrition, 55(Suppl. 2), 55–69. https://doi.org/10.1007/s00394-016-1229-6
- Yeomans, M. R., Spetch, H., & Rogers, P. J. (1998). Conditioned flavour preference negatively reinforced by caffeine in human volunteers. Psychopharmacology, 137(4), 401–409. https://doi.org/10.1007/s002130050636
- Yeomans, M. R., Mobini, S., & Chambers, L. (2007). Additive effects of flavour–caffeine and flavour–flavour pairings on liking for the smell and flavour of a novel drink. Physiology & Behavior, 92(5), 831–839. https://doi.org/10.1016/j.physbeh.2007.06.006
Regulatory and reference sources
- EFSA Panel on Dietetic Products, Nutrition and Allergies (NDA). (2015). Scientific opinion on the safety of caffeine. EFSA Journal, 13(5), 4102. https://doi.org/10.2903/j.efsa.2015.4102
- Regulation (EU) No 1169/2011 of the European Parliament and of the Council of 25 October 2011 on the provision of food information to consumers, Annex III, point 4.1. http://data.europa.eu/eli/reg/2011/1169/oj
- Linstrom, P. J., & Mallard, W. G. (Eds.). NIST Chemistry WebBook, NIST Standard Reference Database Number 69. National Institute of Standards and Technology. Caffeine, IR spectra: gas phase (Sadtler Research Labs under US-EPA contract), as shown in the MolGod viewer, band positions read from the data on 31 October 2026; and solid (Pacific Northwest National Laboratory, Bruker Tensor 37 FTIR, diffuse reflectance, March 2017, public domain). https://doi.org/10.18434/T4D303
- NIST Mass Spectrometry Data Center. NIST Standard Reference Database 1A, caffeine electron-ionisation mass spectrum (NIST MS number 290714), via the NIST Chemistry WebBook (SRD 69), as shown in the MolGod viewer; peaks read from the data on 31 October 2026. https://doi.org/10.18434/T4H594
- Abdull Manap, M. R. (2018). Analysis of caffeine powder by ATR-FTIR (Version 1) [Data set]. Mendeley Data. Caffeine anhydrous (Sigma), normalised spectrum. https://doi.org/10.17632/j8m6sfnh5f.1
- European Chemicals Agency (ECHA). Harmonised classification and labelling, Annex VI to Regulation (EC) No 1272/2008 (CLP): caffeine, EC 200-362-1, CAS 58-08-2, index 613-086-00-5, Acute Tox. 4*, H302 (export of 7 July 2026). https://echa.europa.eu/information-on-chemicals/annex-vi-to-clp
- PubChem. Caffeine (CID 2519), sections Odor (“Odorless”), Solubility (1 g in 46 mL water, 5.5 mL water at 80 °C, 1.5 mL boiling water) and Color/Form (“hexagonal prisms”), citing O’Neil, M. J. (Ed.). (2013). The Merck Index. Royal Society of Chemistry; Color/Form (“long, flexible, silky crystals”), citing Lewis, R. J. Sr. Hawley’s Condensed Chemical Dictionary (15th ed.). Wiley; Melting Point (236.2 °C), citing Haynes, W. M. (Ed.). CRC Handbook of Chemistry and Physics (94th ed.). CRC Press. https://pubchem.ncbi.nlm.nih.gov/compound/2519