
Take a 3D-printed caffeine molecule and hand it to a first-year student. Twenty-four balls, twenty-five sticks. Now ask a simple question: which of these is nitrogen? Whether the student answers in one second or never depends less on how clever they are than on how the model was made. This article puts four versions of the same molecule side by side (one colour, element colours, engraved symbols, and both), explains what research already tells us about each, shows what we measured on our own model, and lays out the experiments we are preparing to find out which one actually helps students learn.
In 30 seconds
- The question. 3D-printed molecular models are known to help students. Colour-coding atoms is the standard upgrade. MolGod adds one more layer: the element symbol engraved on every atom. Does the letter add anything that colour alone does not?
- Our prediction, in one line. Colour should win when students look for an element (“find both oxygens”). The engraved letter should win when they need to name an atom without a colour key. Together they may cover both.
- The status. These are 19 hypotheses, every one with the result that would prove it wrong. Nothing has been measured on students yet. The colour-and-engraved caffeine shown below is a finished, slicer-checked print design that has not yet been printed; our real prints so far are single-colour.
- For your class tomorrow. A 45-minute caffeine lesson with coffee cups, an energy-drink can, a blind smell test with real caffeine and the model, minute by minute, plus modules on caffeine crystals under polarised light and a live infrared spectrum read with the model in hand, and a 60-minute version that joins them.
Try the 10-second test → All 19 hypotheses → The caffeine lesson →
Author: Adrian Koska · MolGod.org · Type: research rationale and study proposal · Published: 1 November 2026 (version 1.0) · Part of the project Engraved molecular models
Contents: 1. Try it yourself · 2. Four versions, one geometry · 3. Why one letter could matter · 4. What research already shows · 5. Finding is not naming · 6. Research questions and hypotheses · 7. What we measured on our own model · 8. How we will test it · 9. What each result would mean · 10. Ethics and integrity · 11. What could go wrong · 12. A caffeine lesson: coffee, energy drinks, crystals, IR · 13. FAQ · 14. How to cite · References
1. Try it yourself: the 10-second test
Before any theory, a small experiment you can run on yourself. Below is caffeine (C8H10N4O2, CAS 58-08-2) in four versions. Start with A and give yourself ten seconds: point to the four nitrogen atoms. Then do the same on B, C and D. Notice not only whether you succeed, but what your eyes and your memory had to do each time.
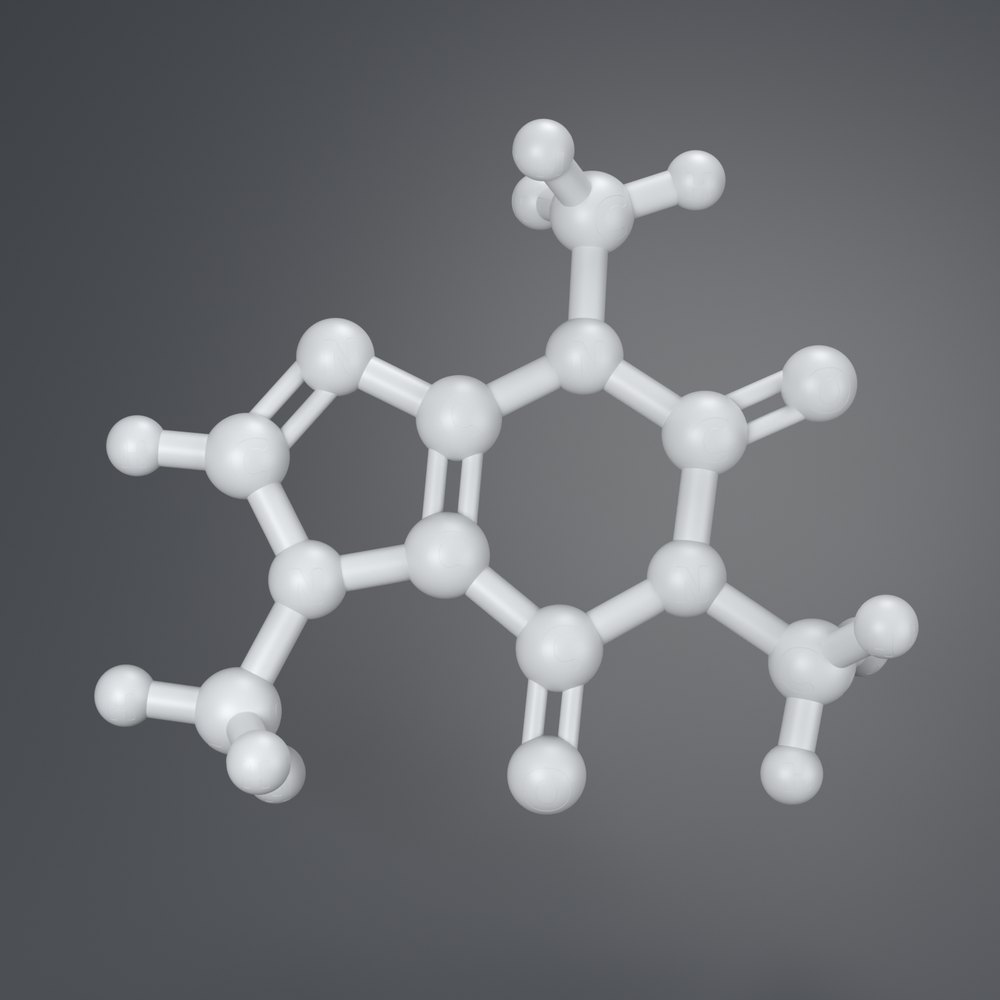
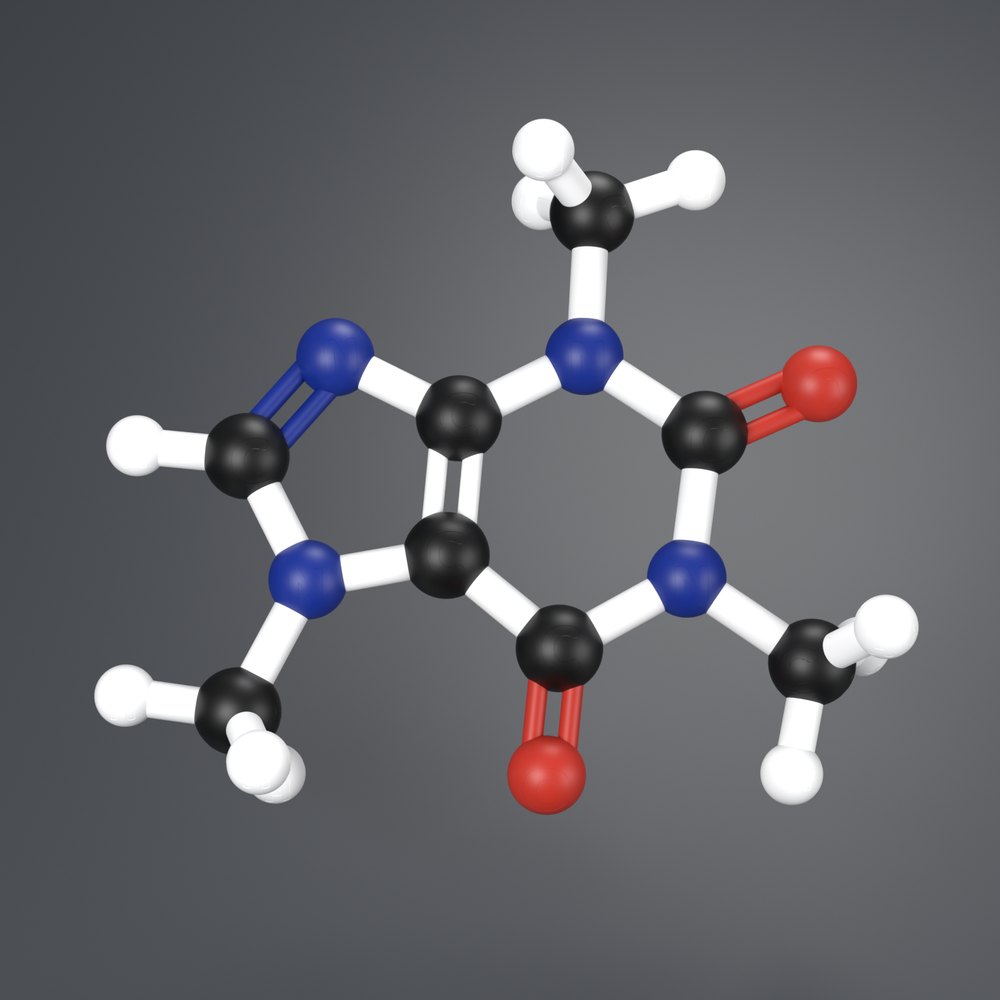
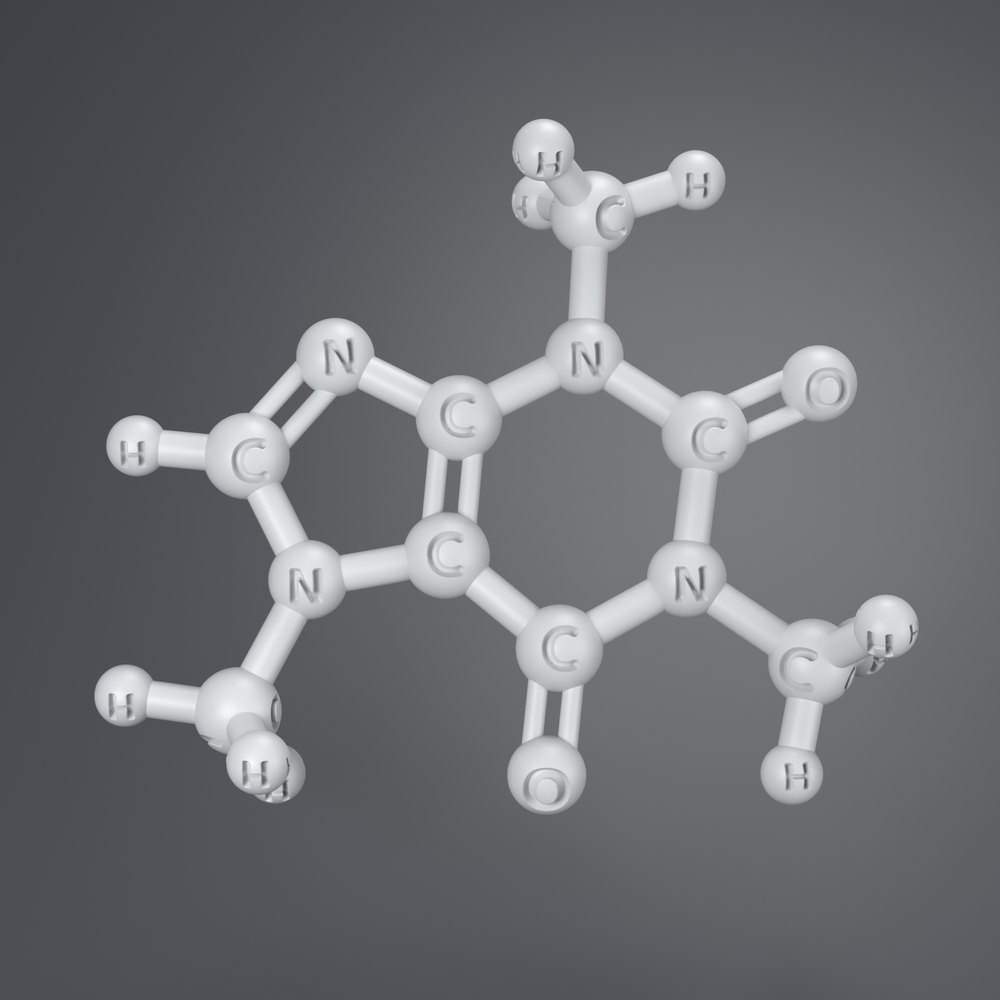
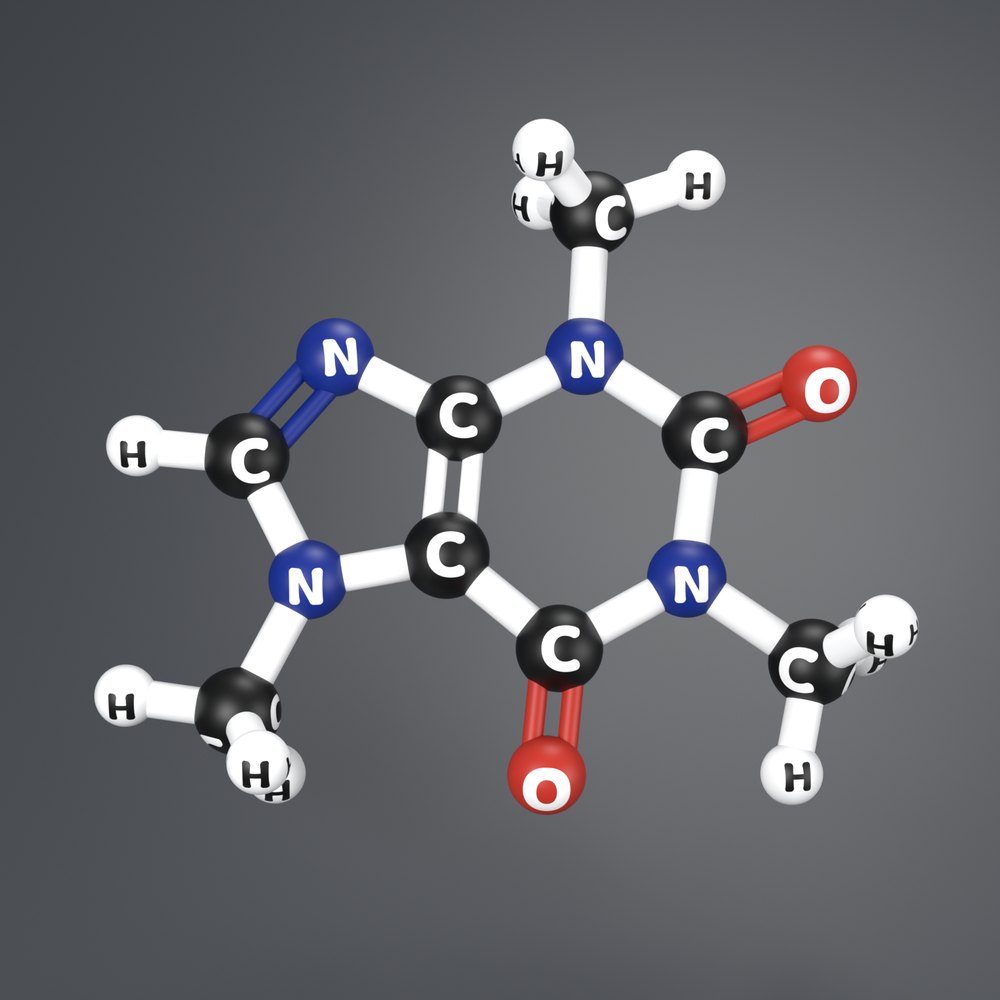
How these pictures were made. All four are renders of one and the same printable mesh (the molecule-only part of our multicolour caffeine print design), with the same camera, lens and lights. Between versions we changed only two things: the colour of the parts, and whether the 0.6 mm-deep letter recesses are filled. In A and B the filled letters take the colour of their own sphere, so the surface reads as smooth; in C the fill is removed and you see the bare engraving, as on a single-filament print. Renders, not photographs.
Answers, and what most people notice
Caffeine has 8 carbon, 10 hydrogen, 4 nitrogen and 2 oxygen atoms. In A, a chemist can still find the nitrogens: they are the ring atoms with three neighbours and no hydrogen, and the two oxygens are the lonely atoms at the end of a double bond. That works, but it needs knowledge a beginner does not yet have. In B the four blue balls stand out almost instantly, provided you already know the colour code. In C you can be certain of every atom, but you read them one by one. In D the blue catches your eye and the letter confirms it.
If your experience matched that description, you have just felt the core of our hypothesis: colour and letters may help with different mental steps. Section 5 explains why vision science predicts exactly this split.
2. Four versions, one geometry
You can read the four versions as three “generations” of a teaching model, A → B → D (one colour, then colour, then colour with symbols), plus one version that completes the picture: C, symbols without colour. Together they form a simple grid: colour yes or no, engraved symbol yes or no. Researchers call this a 2 × 2 factorial design. Its strength is that it separates the effect of colour, the effect of the letter, and whether the two help each other or get in each other’s way. Without C, any advantage of D could come from the letters, from the colour, or only from the combination, and we could not tell which.
| Version | Colour | Symbol on atom | Steps from “this ball” to “N” |
|---|---|---|---|
| A One colour | no | no | count neighbours, recall valences, infer the element (needs prior knowledge) |
| B CPK colour | yes | no | see colour → recall or look up the colour key → symbol |
| C One colour, engraved | no | yes | turn the model or the head until the letter faces you → read it |
| D CPK colour, engraved | yes | yes | see colour, read letter; either route works, and each checks the other |
MolGod already publishes two of these versions for every molecule in the collection: a plain single-colour model (A) and an engraved single-colour model (C). For caffeine we have also built the full colour-and-letters version (D) as a ready-to-print project for a six-colour printer. Version B is the conventional colour model used by most commercial kits and most published 3D-printing work.
3. Why one letter could matter
Chemistry asks students to think on three levels at once: what they can see and touch, the invisible world of atoms and molecules, and the symbols chemists write (Johnstone, 1991). Later work refined this “chemistry triplet” and warned against using it too loosely (Talanquer, 2011), but one finding has held up well: moving between levels is hard for novices. In a classic study, experts sorted chemical representations by the underlying idea, while novices sorted them by surface features (Kozma & Russell, 1997).
A molecular model lives on the second level: it shows atoms you will never see. The symbol N lives on the third. In versions A and B the student must build that bridge in their head, every time. In versions C and D the bridge is printed on the atom. That is the whole idea, and it is also why it deserves a careful test rather than a slogan: a bridge that is always there might help beginners cross, or it might let them stop learning to build their own.
4. What research already shows
Physical models help, sometimes quickly
Working with concrete models helps students translate between 3D structures and 2D diagrams (Stull, Hegarty, Dixon & Stieff, 2012). In a recent randomised controlled experiment with a compensatory design, where each of two groups served in turn as control and intervention, presenting accurate 3D-printed models of proteins and DNA and letting students handle them for three to five minutes was enough to turn low-gain lectures into medium-gain ones (Boiangiu, Popa & Mihășan, 2025).
Two cautions come with this. Physical and virtual models can work equally well, so a benefit has to come from a property of the model rather than from its being physical (Stull & Hegarty, 2016). And students who learn with a model in hand do not automatically do well once it is taken away (Stieff, Lira & Scopelitis, 2016). Any test of engraved letters therefore has to include tasks done without the model.
Colour printing is arriving in classrooms
Most consumer printers print one colour at a time, which has slowed the adoption of printed models in organic chemistry. Martin, Eisner and Klosterman (2023) published a general procedure for multicolour space-filling and orbital models that can be printed and assembled with affordable single-filament printers, and multicolour 3D-printed orbital models have since been developed for first- and second-semester organic chemistry courses (Endeshaw et al., 2025; Endeshaw, Gonzalez & O’Leary, 2026). These papers make colour models practical. As far as we can tell from them, none compares colour with engraved element symbols.
Signals and labels help most where learners know least
Highlighting what matters supports learning with pictures and media. A comprehensive meta-analysis of signals that link text and pictures supports this signalling principle particularly for learners with low prior knowledge (Richter, Scheiter & Eitel, 2016; see also Schneider, Beege, Nebel & Rey, 2018). Placing a label next to what it describes, instead of in a separate legend, also tends to help: meta-analyses of the spatial contiguity effect favour integrated designs (Ginns, 2006; Schroeder & Cenkci, 2018). Eye tracking shows one reason: in three experiments, learners who saw integrated presentations moved their eyes between words and the matching part of the diagram far more often than learners who saw a separate paragraph or legend, and in two of them they also did better on transfer tests (Johnson & Mayer, 2012). A separate key forces attention to split between two sources (Chandler & Sweller, 1991). A colour key on a worksheet is exactly such a separate source; a letter on the atom is not. Pairing a verbal label with a visual form is also what dual coding theory would favour (Paivio, 1991).
One honest qualification: all of this evidence comes from pictures, screens and text. Whether it carries over to a physical object turned in the hand is precisely what has not been tested.
The same help can hurt experts
Instructional support that helps beginners can lose its effect, or even backfire, for more experienced learners: the expertise reversal effect (Kalyuga, Ayres, Chandler & Sweller, 2003). A third-year chemistry student does not need to be told that the red ball is oxygen. We therefore expect any benefit of letters to shrink with prior knowledge, and we will measure that rather than hope it away.
Colour does not reach everyone
Large random population surveys put inherited red–green colour deficiency at about 8% of men and 0.4% of women of European descent, and 4–6.5% of men of Chinese and Japanese descent (Birch, 2012). In chemistry, colour-based cues such as indicators are a known accessibility problem (Roberts, Hynes, Stacey & MacDonald, 2023). An engraved symbol does not depend on colour vision, and because it is part of the geometry it can in principle be felt; tactile, lettered 3D-printed atom pieces have been described for sighted and visually impaired students (Singhal & Balaji, 2020).
The gap. We did not find a peer-reviewed study that compares these four versions on the same molecule, with the same geometry, and measures both speed and learning. The pieces of evidence exist separately. The direct test does not. Our search covered journal metadata and abstracts, not every full text, so we phrase this as “we did not find” rather than “it does not exist”.
5. Finding is not naming: the prediction that could prove us wrong
Here is the part we find most interesting, because it gives the experiment teeth. Vision science distinguishes features that guide attention across a whole scene from features that have to be inspected item by item. In feature-integration theory, a target that differs by a simple feature such as colour can be spotted across a display almost at once, while targets defined by combinations of features need a serial, one-by-one search (Treisman & Gelade, 1980). Colour is among the attributes that most reliably guide attention; the identity of a letter generally is not (Wolfe & Horowitz, 2004).
Applied to a molecular model, this predicts that colour and letters help with different tasks:
- FIND — “Point to all the oxygen atoms.” A search task. Colour should make it fast (B, D). Letters alone (C) should be slower, because each atom has to be read.
- NAME — “What element is this atom?” with no colour key in sight. An identification task. Letters should make it accurate (C, D). Colour alone (B) helps only students who have memorised the code.
- REMEMBER — a week later, without the model: “Which atoms in caffeine are nitrogen, and where are they?” Here the question is whether seeing colour and symbol together leaves a stronger trace. We genuinely do not know.
- TRANSFER — a molecule the student has never handled. Does the skill move with them, or stay with the model?
This is a risky prediction in the good sense. If letters turn out to speed up finding as much as colour does, or if colour alone matches letters on naming for students who have just been shown the key, our account is wrong and we will say so. And because all four versions share the same geometry, we expect no difference at all on purely geometric questions such as “is this ring flat?”. That is a built-in check: if the versions differ there, something other than colour or letters is at work.
6. Research questions and hypotheses
Research questions
- RQ1 Does colour coding shorten the time to find and identify elements, compared with a single-colour model?
- RQ2 Do engraved symbols shorten it further, on top of colour?
- RQ3 Do engraved symbols make atom identification more accurate?
- RQ4 Does colour plus symbol improve immediate learning about molecular composition?
- RQ5 Does it improve what students remember a week later?
- RQ6 Does what students learn carry over to molecules they have never handled?
- RQ7 Do the benefits differ between students with little and with more prior chemistry knowledge?
- RQ8 Do symbols on the atoms reduce how often students need a colour key or ask for help?
- RQ9 Do colour and letters change how quickly students find specific bonds, and do they leave purely geometric judgements untouched?
- RQ10 Do letters lower or raise the mental effort of working with the model, and which version is the most efficient overall?
- RQ11 Can the engraved symbols be read reliably on real prints, and does placing them all around the sphere help?
- RQ12 Does using the model as a self-test (guess first, then turn it to check) improve memory?
- RQ13 Do engraved symbols open the model to students who cannot rely on colour, or on sight?
- RQ14 Do ready-to-print models with a lesson plan save teachers preparation time?
- RQ15 Does holding the model help students connect an infrared spectrum to the bonds that produce it?
Hypotheses
We list every hypothesis we intend to test, including the uncomfortable ones. Each names the comparison, the task and the direction, together with the result that would count against it. They are grouped by the study that tests them (section 8) and will be written down before any data are collected.
| Hypothesis | What would count against it |
|---|---|
| H1 · Colour speeds finding. On FIND tasks, correct responses are faster with colour (B, D) than without (A, C). | No difference, or C as fast as D. |
| H2 · The letter adds speed on top of colour (the central MolGod question). On NAME tasks, D is faster than B, while on FIND the gain is small or absent. | D and B equivalent on NAME, within a pre-set smallest effect of interest (tested with equivalence tests; Lakens, 2017). |
| H3 · Letters make naming accurate without a key. On NAME tasks without a colour key, accuracy is higher with letters (C, D) than without (A, B). | B matches D in accuracy among students who were shown the colour key once, before the task. |
| H4 · Colour plus letter is the most accurate. Overall identification accuracy is highest for D: higher than A and B, and at least as high as C. | D no more accurate than B, or less accurate than C (the combination confuses rather than helps). |
| H5 · Colour helps find bonds, letters do not. Finding specific bonds (the two C=O and the C=N double bonds) is faster with colour (B, D), because in our colour models those double bonds carry the colour of their heteroatom; letters add nothing here. | Letters change bond-finding times, or colour does not. |
| H6 · Geometry is untouched (a null hypothesis by design). On purely geometric questions, such as whether a ring is flat or which atoms belong to the five-membered ring, the four versions do not differ. | A difference here means something other than colour or letters is at work; we would investigate before interpreting any other result. |
| Hypothesis | What would count against it |
|---|---|
| H7 · Better immediate learning. Right after the session, D scores higher than B, and B higher than A, on composition and identification questions answered without the model. | No difference on the immediate test. |
| H8 · Better memory a week later. On the delayed test, D scores higher than B. | No difference at seven days. (This is the least certain of our predictions.) |
| H9 · Transfer. Students who learned with D identify atoms in unseen molecules (theophylline, aspirin) better than those who learned with B. | No difference, or worse: letter groups struggling once the letters are gone would mean support that did not become skill. |
| H10 · Beginners gain most. The advantage of letters shrinks as prior chemistry knowledge rises (expertise reversal). | The benefit is the same for beginners and advanced students, or larger for advanced ones. |
| H11 · Less need for a key. With letters (C, D), students consult the colour key and ask for help less often than with B. | Equal numbers of look-ups across versions. |
| H12 · Less effort, more efficiency. D is rated as less mentally effortful than B for the same or better test scores, so its instructional efficiency is higher (Paas & Van Merriënboer, 1993). | The competing prediction: colour plus text is visual clutter, effort goes up and scores do not. |
| Hypothesis | What would count against it |
|---|---|
| H13 · The letters are legible. On real prints, at arm’s length and in ordinary classroom light, students read at least 95% of C, N and O symbols and at least 90% of H symbols correctly. These pass marks are our own and are fixed before measuring. | Below the marks: the models are fixed first, and no learning study starts until they pass. |
| H14 · All-round letters beat front-facing letters on the share of atoms a student can name without turning the model, with no loss of legibility. | No gain, or poorer print quality on the all-round version. |
| H15 · Rotate to reveal. Guessing each atom from the side without letters and then turning the model to check improves memory a week later, compared with spending the same time looking at the labelled side (the testing effect; Roediger & Karpicke, 2006). | No difference at seven days. |
| H16 · Colour-independent access. Students with colour-vision deficiency do as well as other students on C and D, but not on B. | No such pattern. (A separate, smaller study, because these groups will be small.) |
| H17 · Readable by touch. Blind and low-vision students can identify engraved symbols by touch reliably enough to use them in learning (an exploratory study with specialist partners). | Touch identification unreliable at this letter size: larger, tactile-specific models would be needed. |
| H18 · Teachers save time. Ready-to-print models with a lesson plan cut lesson-preparation time and perceived workload, measured with NASA-TLX (Hart, 2006). This is Study B of the project plan. | No difference in preparation time or workload. |
| H19 · From the hand to the spectrum. Students who interpret a caffeine IR spectrum while examining the matching physical model identify and explain the dominant contributions of groups of atoms to the observed bands more accurately than students working with the identical spectrum and on-screen visualisation but without the physical model, both straight after the session and in a test without the model seven days later (an exploratory study). | No difference: the on-screen highlighting alone does the job, and the model adds nothing here. |
One more expectation is practical rather than theoretical. Version D needs a multicolour printer; version C prints on any machine in one filament. If C turns out to give most of what D gives, that is excellent news for every school with an ordinary printer.
7. What we measured on our own model
A study is only as fair as its models. If version D were larger, glossier or easier to hold, any advantage could come from that rather than from the letters. Our models are procedurally generated by our own software from the PubChem computed 3D conformer, so the same record always produces the same mesh, and atom positions, sphere sizes and bond lengths are identical across versions by construction. On the caffeine mesh used for the pictures above we checked the following.
| What we checked | Result |
|---|---|
| Atoms in the mesh vs the formula | 24 spheres: 8 C, 10 H, 4 N, 2 O, matching C8H10N4O2; every one of the 24 carries an engraved symbol |
| Sphere diameters | carbon about 9.0 mm, nitrogen 8.2 mm, oxygen 8.1 mm, hydrogen 6.4 mm |
| Engraving depth | 0.6 mm recess, filled with a contrasting colour in version D (white on C, N, O; black on H), left empty in version C |
| Symbols facing the viewer, from the camera position used for the pictures above | 19 of 24 within 60° of the line of sight, 15 within 30° |
| Symbols facing the viewer from directly behind | 0 of 24 |
The last two rows matter more than they look. In this print design the letters sit on the side of each sphere that faces forward and upward, the side you see when the model stands on its base. That was a deliberate trade-off: we also built and digitally checked a version with letters all around each sphere, but it needed printing supports standing on the print bed, so the print design uses front-facing letters. For the study this becomes a measurable property in its own right: how many atoms can a student name without turning the model? Front-facing versus all-round letters is a design choice we can test, not just argue about.
For version D the slicer reports, for the full caffeine project with its base and pencil supports on the Bambu Lab H2C: six colours, about 16 hours, about 162 g of PLA and 988 filament changes (details on the caffeine page). Those numbers are part of the story. A colour model costs time and needs a specific printer; the single-colour engraved version prints on almost anything. Whether the extra effort buys extra learning is exactly what the study can answer.
8. How we will test it
We plan four steps, because “can the letters be read?”, “do they speed up seeing?”, “do they improve learning?” and “how should the model be used?” are different questions and need different designs, plus smaller secondary studies on access and on teachers’ time. Studies 1 to 3 will be preregistered on the project’s OSF page before recruitment (Nosek, Ebersole, DeHaven & Mellor, 2018) and run with a partner university under its ethics approval.
Study 0 · Can students actually read the letters?
A short technical study on real prints, before any learning experiment. If the letters cannot be read in a real classroom, versions C and D would fail for a technical reason rather than a cognitive one, and the learning study would measure the wrong thing.
- Prints: the four caffeine versions from the same files, plus engraving variants on the smallest spheres (hydrogen): depth, letter height and stroke width.
- Close-up photographs of every symbol type on every print, at a fixed scale, published with the files.
- Reading test: students name symbols at arm’s length under ordinary classroom light, with the model held still in a fixed orientation; we record the share of atoms named correctly without turning the model.
- Front-facing versus all-round letters compared on the same measure.
- Print quality: blurred or broken letters, stringing and surface damage recorded per print; a model that fails is reprinted, not used.
Study 1 · Seeing: a fast, within-person experiment
- Who: undergraduates in introductory chemistry. Each person sees all four versions, so everyone serves as their own control.
- What: short timed trials on printed models: FIND (“touch every oxygen”), NAME (“which element is the atom with the sticker?”), BOND (“touch both C=O double bonds”) and a few purely geometric questions, with no colour key on the table.
- Molecules: several, not only caffeine, so nobody can simply memorise one shape. Each molecule appears in each version across participants, rotated in a Latin square.
- Measured: accuracy, and response time on correct answers.
Study 2 · Learning: a randomised classroom experiment
- Before (T0): a short test of element symbols, structural formulas, familiarity with the CPK colours and prior experience with models, plus a spatial-ability test (Purdue Visualization of Rotations; Bodner & Guay, 1997), because spatial ability matters in chemistry (Harle & Towns, 2011).
- Random assignment to one of the four versions, stratified by prior knowledge so that no group starts ahead. A fifth, drawings-only group, as in the original project plan, can be added as a baseline.
- Ten minutes with caffeine, the same instructions, the same worksheet and the same instructor script for everyone. Only the model differs.
- Immediately after (T1), without the model: NAME, FIND on paper, composition (“how many N atoms?”), matching the model to its 2D structure, and a few purely geometric questions as the built-in check (H6).
- Seven days later (T2), without the model: the delayed test. A further test after about 28 days if the partner can host it.
- Transfer: theophylline (CAS 58-55-9), caffeine’s close relative with one methyl group fewer, as near transfer; aspirin (CAS 50-78-2), with no nitrogen at all, as far transfer.
The lesson demonstrations in section 12 (smell test, label, infrared, crystals) are not part of the study session. If a participating class also runs them, every group gets exactly the same demonstrations, at the same point, so that they cannot become a hidden difference between the four model versions.
Two design details matter more than they look. First, tests are themselves learning events (Roediger & Karpicke, 2006), so every group takes exactly the same tests at the same times. Second, speed means nothing without accuracy: a model that makes students answer faster but more often wrongly is not better.
Study 3 · Using the model: rotate to reveal
Our measurement in section 7 turned a design limitation into a teaching tool. Because the letters face forward, the back of the model shows no symbols at all, so the same object can work like a flashcard: look at the plain side, name each atom, then turn the model round and check. Retrieving an answer is known to strengthen memory more than re-reading it (Roediger & Karpicke, 2006). Study 3 tests whether that holds for a model in the hand.
- Who: students working with an engraved model (C or D), randomly split into two groups.
- Rotate to reveal: the model starts with its plain side facing the student; the student names each atom, then turns the model and checks.
- Look and learn: the same time spent with the labelled side facing the student.
- Measured: the same seven-day test as Study 2 (H15).
Secondary studies
- Colour-vision deficiency (H16): students who report a colour-vision deficiency take the Study 1 tasks on all four versions; analysed separately because the group will be small.
- Touch (H17): with specialist partners, blind and low-vision students identify engraved symbols by touch on prints at several sizes. Exploratory: its first result may simply be the smallest letter that works.
- Teachers’ time (H18): preparation time and NASA-TLX workload for a lesson built with and without ready-to-print models, as described in the project plan.
- Model and spectrum (H19): two randomised groups receive the same short talk, time, instructions and questions with the same caffeine IR spectrum in the viewer; one group also holds an engraved model. Measured: correct assignment of selected bands to the groups that contribute most, correct identification of those atoms, the quality of the explanation linking spectrum and geometry, and a test without the model after seven days. Smell, crystals and colour stay out of this study, so that the model is the only difference.
What we measure
| Outcome | How |
|---|---|
| Primary: naming accuracy | share of atoms correctly identified, without a colour key |
| Primary: response time | time to a correct answer; wrong answers analysed separately, never mixed into the times |
| Immediate learning (T1), delayed learning (T2) | the same question types, without the model |
| Bond finding and geometry | time and accuracy on BOND tasks; accuracy on geometric questions (expected to be equal across versions) |
| Transfer | accuracy on theophylline and aspirin |
| Legibility (Study 0) | share of symbols read correctly at arm’s length; share of atoms named without turning the model |
| Key look-ups and help requests | counted by the observer from a standard checklist |
| Mental effort | a single 9-point rating after each task block (Paas, 1992) |
| Confidence and perceived usefulness | short rating scales |
“Learning efficiency”, defined before we measure it. The phrase is easy to use loosely, so we fix its meaning in advance. We will report it in two ways: accuracy per minute of learning time, and instructional efficiency, which combines test performance with the mental effort students report (Paas & Van Merriënboer, 1993). A version that gives the same score with less effort is more efficient; a version that is fast to read but leaves nothing behind a week later is not. Faster identification of an atom is not the same as faster understanding of a molecule, and we will report the two separately.
Analysis and sample size
Response times are skewed and come from many items per person, so we will analyse them with mixed-effects models that treat participants and items as random effects (Baayen, Davidson & Bates, 2008), using generalised models suited to response-time distributions instead of forcing them into a normal shape (Lo & Andrews, 2015). Accuracy will be analysed with logistic mixed models. The three planned contrasts are colour versus no colour, letter versus no letter, and the key comparison D versus B. We will report effect sizes with confidence intervals, exact p-values, missing data and checks of model assumptions, correct for multiple comparisons, and use equivalence tests where the question is “is there no meaningful difference?” (Lakens, 2017).
Sample sizes below were computed for a two-sided test at α = 0.05 and 80% power, the standard approach implemented in G*Power (Faul, Erdfelder, Lang & Buchner, 2007). They are planning figures; the preregistration will fix the final numbers using pilot data.
| Effect we want to detect (Cohen’s d) | Study 1 (same people, paired) | Study 2 (separate groups) |
|---|---|---|
| 0.3 (small to medium) | 90 people | 176 per group |
| 0.4 | 52 people | 100 per group |
| 0.5 (medium) | 34 people | 64 per group |
| 0.5, corrected for three contrasts (α = 0.0167) | — | 86 per group |
The table shows why Study 1 comes before Study 2: a within-person design reaches useful precision with a few dozen students, and its results tell us which effect size is realistic before we ask four classroom groups of around a hundred students each to take part. A small pilot of Study 2, with 20 to 30 students per version, will test the procedure and the materials, not the hypotheses.
9. What each result would mean
Deciding in advance what we will do with each possible outcome is the best protection against reading the data the way we would like. Here is our commitment.
| If we find… | …it means, and we will |
|---|---|
| D clearly beats B on naming, and C comes close to D | Letters carry most of the benefit. Recommend the single-colour engraved version to every school; colour becomes a bonus, not a requirement. |
| D beats both B and C, and C alone does little | Colour and letters work together. Develop affordable colour versions and say clearly that the combination is what helps. |
| B equals D | The letters add nothing on top of colour for these tasks. Say so on this page, and keep engraving only where colour is not available or not seen. |
| Letters help at once but not after a week, or not on transfer | Support that does not become skill. Rethink how the models are used in lessons, for example by taking them away earlier. |
| Letters cannot be read reliably (Study 0) | Fix the models first: size, depth, placement. No learning study until the letters pass. |
| Rotate to reveal beats look-and-learn (Study 3) | Make the self-test the standard way to use engraved models in every MolGod lesson plan. |
| The versions differ on purely geometric questions | Something other than colour or letters differs between the models. Find it and remove it before trusting any other result. |
10. Ethics and integrity
- Ethics approval — obtained by the partner institution before any data collection; participation voluntary, with informed consent and the right to withdraw.
- Data — as little personal data as possible, pseudonymised, handled under applicable data-protection law.
- Preregistration — hypotheses, primary outcomes, sample size and analysis fixed on OSF before recruitment; any deviation reported and explained.
- All results published — including null, negative or mixed findings, together with the anonymised data, the test materials and the exact print files with their checksums.
- Conflict of interest — we design and publish these models, and MolGod.org also provides commercial chemical-documentation services. The models are free and openly licensed, and no external funding supports this project. We will not describe our own study as independent validation; scoring will be done blind to version where possible.
When the data are in, we intend to submit the results to a peer-reviewed chemistry education journal such as the Journal of Chemical Education, Chemistry Education Research and Practice or Biochemistry and Molecular Biology Education. A working title: Do engraved element symbols improve molecular identification and learning? A comparison of single-colour, colour-coded and symbol-integrated 3D-printed molecular models.
11. What could go wrong
- Novelty. A colourful new object is exciting. Excitement is not learning, which is why the delayed test and the transfer molecules carry so much weight.
- Who runs the study. We have an interest in the result. Independent scoring, a partner institution, preregistration and open data are how we try to keep ourselves honest.
- One molecule is not chemistry. Caffeine contains only four elements. Halogens, sulfur and phosphorus, and much larger molecules, may behave differently. Later studies should vary molecular size, geometry and elements.
- Small spheres, small letters. Hydrogen spheres leave little room for a symbol. Study 0 exists to catch this first.
- Prior knowledge of colours. Students who already know the CPK code are, in effect, reading B with an invisible key. That is why familiarity with the colours is measured and why H10 exists.
- Colour on the bonds, too. In our colour models the C=O and C=N double bonds take the colour of their heteroatom. That is the same in B and D, so it does not affect the central D-versus-B comparison, but it is part of what “colour” means in A-versus-B, and H5 measures it directly.
- Visual clutter. Colour plus letters is more information. If it distracts rather than helps, mental effort will rise and accuracy will not; our measures are designed to show that.
- Feel and handling. Engraved and filled surfaces feel slightly different. We will keep material, size and mass the same and note any differences we cannot remove.
- Physical, not digital. Results apply to printed models in the hand. On-screen models may behave differently (Stull & Hegarty, 2016).
- The multicolour print is still a design. Version D has not yet been printed. Renders say nothing about real legibility; only real prints go into the study.
12. Your class today: a caffeine lesson with coffee, energy drinks, crystals and infrared
You do not have to wait for our results to use any of this well. A few suggestions that follow from research already published, not from our hypotheses:
- Let students handle the model, even briefly. Three to five minutes made a measurable difference in the study by Boiangiu and colleagues (2025).
- If you use colour, put the key on the model or right next to it, not on a separate sheet, to avoid split attention.
- Take the model away at the end. Ask students to draw the structure or name the atoms from memory, because the skill has to work without the object.
- Only have a single-colour printer? Print the engraved version. Every MolGod molecule page offers a plain and an engraved model for free, and the teachers’ page collects the most useful ones.
- Want to see what a model cannot show? Open caffeine in the interactive 3D viewer and click any atom.
A 45-minute lesson: coffee, an energy drink and one molecule
Caffeine is the rare molecule that most students already carry in their hand: in a coffee cup on the way to school, or in a can of energy drink. That makes it a perfect first lesson. Here is a minute-by-minute plan for students aged about 14–18 or first-year undergraduates. It works with any engraved model (C or D); the “rotate to reveal” step needs one. This lesson is for everyday teaching: it is not one of the controlled studies above, although we would love to hear how it went.
On the teacher’s desk: two or three cups of coffee from different places, in plain cups; a can of energy drink with the brand covered by tape but the nutrition label visible; four identical small closed jars, numbered 1–4 on the bottom only: ground coffee, a little energy drink, pure caffeine dissolved in water at about the strength of an energy drink (roughly 0.3 g per litre, made up in the prep room from caffeine bought from a laboratory or school chemical supplier, with its safety data sheet) and plain water as the control; a small sealed transparent vial of solid caffeine, to look at but never to open; one engraved caffeine model per pair; a printout of the 2D structure.
- 00:00–03:00 · The question. Cups and can on the desk. “What do all of these have in common?” No models, no slides yet.
- 03:00–06:00 · First guess. “Which chemical do you link with coffee and energy drinks?” Almost every class says caffeine. Write the answers on the board.
- 06:00–10:00 · The blind smell test. The teacher holds each numbered jar in turn, lifts the lid briefly about 20 cm from the students and wafts the air towards them; nobody sniffs from the jar or touches its contents. Students write down what they smell for each number and guess: “One of these jars contains real caffeine, as much per litre as an energy drink. Which one?” Then: “Coffee and the energy drink both contain caffeine. So why do they smell so different?” Collect hypotheses without giving the answer.
- 10:00–14:00 · The reveal. Turn the jars over and hold up the sealed vial of white solid: this is what was dissolved in jar 3. Most students will not have been able to tell the caffeine solution from plain water, although it holds about as much caffeine as the energy drink in jar 2, which smells strongly. That is the result: pure caffeine is odourless (PubChem, citing the Merck Index). The water jar is what makes it evidence rather than an impression, a small lesson in why scientists use controls. The aroma of coffee comes from a complex mixture of many other compounds (Sunarharum, Williams & Smyth, 2014). The same molecule sits in two drinks that smell completely different, and on its own it smells of nothing at all: the difference between a substance and a mixture, demonstrated by the students’ own noses.
- 14:00–19:00 · Read the label. In the EU, drinks other than coffee and tea with more than 150 mg of caffeine per litre must carry the words “High caffeine content. Not recommended for children or pregnant or breast-feeding women”, followed by the caffeine content in mg per 100 ml (Regulation (EU) No 1169/2011, Annex III, point 4.1). Students find the number on the can and work out the caffeine per can; typical energy drinks contain about 300–320 mg per litre (EFSA Panel on Dietetic Products, Nutrition and Allergies, 2015), so a 250 ml can holds roughly 75–80 mg. Then the twist: the coffee cups carry no such number. In one study of coffee-shop coffee, caffeine ranged from 58 to 259 mg per serving, and the same drink bought from the same shop on six consecutive days ranged from 259 to 564 mg (McCusker, Goldberger & Cone, 2003). “So which contains more caffeine, the can or the cup?” The honest answer: it depends, and only one of them tells you.
- 19:00–24:00 · Meet the molecule. Each pair gets a model. Count the atoms, read the symbols, write the formula and check it: C8H10N4O2, 24 atoms.
- 24:00–30:00 · Rotate to reveal. Turn the model so that its plain back faces the students. They name each atom they can from its position and bonds (or from its colour on version D), then turn the model round and check against the engraved letters. Swap roles in the pair and repeat.
- 30:00–35:00 · 3D meets 2D. Students match the model to the printed structure: find the four nitrogens, the two C=O double bonds, the two rings. Which ring has five atoms, which has six?
- 35:00–40:00 · Models away. Quick quiz from memory: the formula; why caffeine does not smell of coffee; why the can has a warning and the cup does not; one substance or a mixture?
- 40:00–45:00 · The last question. “Is a cup of coffee one chemical, or a whole world of molecules? And what does the label on the can tell you that the cup cannot?” Each student writes one sentence they did not know an hour ago.
Stretch task for older students. The molar mass of caffeine is about 194.19 g/mol. How many caffeine molecules are in 80 mg? (About 4.1 × 10⁻⁴ mol, or roughly 2.5 × 10²⁰ molecules: a quarter of a thousand billion billion copies of the object in their hand.)
Extension module (15 minutes, or the next lesson): from one molecule to a crystal
The model in the students’ hands is one molecule. The white solid in the sealed vial is trillions of them, and when they pack in order they form crystals that turn into small rainbows under polarised light. This module asks one question: is a crystal of caffeine one giant molecule? (No: it is an ordered arrangement of very many separate molecules.)
- Before the lesson, in the prep room: grow the crystals. Caffeine is far more soluble in hot water than in cold. According to the Merck Index, 1 g dissolves in 46 ml of water at room temperature but in only 5.5 ml at 80 °C (PubChem, citing the Merck Index). Dissolve a small amount in hot water, cover the beaker and let it cool slowly and undisturbed; caffeine comes out of water as long, flexible, silky crystals (PubChem, citing Hawley’s Condensed Chemical Dictionary). Seal a few crystals under a cover glass or in a closed Petri dish for the lesson. No time or no prep room? A ready-made sealed preparation of caffeine crystals works just as well; the teacher then only has to bring it.
- Students calculate first. “We dissolved 1 g in 5.5 ml of water at 80 °C and let it cool to room temperature. How much caffeine can no longer stay dissolved?” At room temperature 5.5 ml holds only about 0.12 g, so roughly 0.88 g, nearly nine tenths, has to come out of solution. (Ignoring the water that the crystals themselves can take up.)
- Make a polarising light box from a laptop. A laptop or tablet LCD screen is a bright source of polarised light (Fakhruddin, 2008). Lay the screen flat, show a plain white page at full brightness, put the sealed crystals on it and hold a sheet of polarising film above them. Turn the film until the white screen goes dark: the polarisers are now crossed.
- The reveal. Against the dark background the crystals light up in colours. Turn the slide slowly and the colours shift; at certain angles a crystal goes dark. Point a phone camera through the film and put the image on the projector so the whole class sees it, or use a microscope with crossed polarisers and a camera if the school has one.
- Why it happens. Crystals that are not cubic split light into two parts that travel at different speeds (birefringence); when the two recombine in the second polariser they interfere, and the colour depends on the crystal’s thickness and orientation. Caffeine qualifies: the crystal structures solved for its anhydrous forms are monoclinic and rhombohedral, not cubic (Lehmann & Stowasser, 2007; Enright, Terskikh, Brouwer & Ripmeester, 2007). The same molecules, packed in a regular pattern, change what light does: a property no single molecule has.
- Back to the model. “Your model has 24 atoms. How many models would it take to build the crystal on the screen?” Use the stretch-task number: the 80 mg in one can already contains about 2.5 × 10²⁰ molecules.
How big can caffeine crystals grow? We have not found a reliable published maximum, and size depends strongly on how slowly the solution cools, how many seed crystals form and the surface they grow on. Rather than quote a number we cannot check, we will grow, photograph and measure our own caffeine crystals, including polarised-light images, and publish the method and the sizes here.
Module: from substance to spectrum (infrared spectroscopy, 10–15 minutes)
So far students have smelled caffeine (nothing), held its model (24 atoms) and seen its crystals (colours). Infrared spectroscopy adds the missing step of real chemistry: measure the substance with an instrument and let the data say what is inside. Bonds vibrate, and each kind of bond absorbs infrared light at its own characteristic wavenumbers. The resulting spectrum is a fingerprint of the substance, and FTIR with an ATR accessory has already been used to determine caffeine in coffee in a published teaching experiment and in soft drinks (Singh, Wechter, Hu & Lafontaine, 1998; Paradkar & Irudayaraj, 2002).
- Know your instrument first. Most handheld and portable IR spectrometers measure by ATR: a few milligrams of powder must touch the measuring crystal and be pressed onto it as the manufacturer describes. It is not point-and-shoot. Check which accessory yours has, and let the teacher or a trained operator prepare and measure the sample from the prep-room caffeine, then clean the crystal as instructed.
- Background, then sample. Record the empty-crystal background, then the caffeine. Put the live spectrum on the projector. Explain the axes: wavenumber in cm−1, increasing to the left by convention, and absorbance (or transmittance) upwards.
- Open the same molecule in the MolGod viewer. On the caffeine page, switch the 3D viewer to its IR spectrum: hovering over a band lights up the atoms of the group that absorbs there, and clicking opens a card explaining it. The band-to-group assignments come from a published correlation table (Pasieczna-Patkowska, Cichy & Flieger, 2025).
- The model in the hand explains the peaks. In the gas-phase reference spectrum shown in our viewer, the two strongest bands lie at about 1686 and 1722 cm−1, in the region where C=O groups absorb (NIST Chemistry WebBook). “Find every C=O group on your model.” There are two; on version D both are red. The students hold the groups that contribute most to the strongest bands they are looking at.
- One peak is not one bond. Say this clearly, because the model makes the shortcut tempting. A band belongs to a vibration of the whole molecule, in which several atoms move at once; in caffeine the two C=O groups sit in the same ring system, so read the carbonyl region as “where the C=O groups contribute most”, not as “one peak for each C=O bond”. Working out exactly which atoms move in each band is the subject of computational studies (for example, Srivastava & Singh, 2013). The viewer highlights groups for the same reason.
- Every spectrum has its own numbers. The reference spectrum in our viewer is caffeine in the gas phase, while the class measures a solid, and other published measurements report other band positions. Expect the same overall pattern, with bands shifted and broadened. Do not force all spectra into one table of numbers: read each spectrum’s own values and discuss why phase and technique move them. Solid-phase references exist, for example NIST’s diffuse-reflectance spectrum of solid caffeine (NIST Chemistry WebBook) and an open ATR-FTIR dataset of anhydrous caffeine powder (Abdull Manap, 2018); we plan to add solid-phase spectra to the viewer, each labelled with its phase and technique. To identify a sample properly, compare its whole spectrum with a reference measured the same way.
- What IR can and cannot say. One band does not prove that a sample is caffeine, let alone that it is pure; the whole pattern does the work. Measuring how much caffeine a drink contains is possible with FTIR-ATR, but needs calibration and a validated method.
The 60-minute version: one substance, four ways of knowing it
With a double period or a university session, the modules join into one story. In the 45-minute version, use a spectrum recorded in advance (or the viewer alone) and a short video of the crystals instead of the live demonstrations.
| Minutes | Stage | What students learn |
|---|---|---|
| 00–05 | Cups and can: the puzzle | caffeine is in everyday products |
| 05–12 | Blind smell test and reveal | substance versus mixture; why a control matters |
| 12–16 | Read the label | mg per 100 ml, mg per can; coffee varies |
| 16–28 | Live IR measurement and the viewer | a real signal from a real sample; bonds vibrate |
| 28–36 | Meet the molecule, find the C=O bonds | formula, 24 atoms, the bonds behind the strongest peaks |
| 36–42 | Rotate to reveal | retrieval: name, turn, check |
| 42–50 | Crystals under polarised light | many molecules in order behave differently from one |
| 50–56 | Models away: quiz | what stayed without the object |
| 56–60 | One sentence each | one substance, four ways of knowing it |
Safety and tone. Nobody drinks or tastes anything; the drinks are props and smell samples only. Pure caffeine is a hazardous substance: its harmonised EU classification is Acute Tox. 4, H302, “Harmful if swallowed” (ECHA, CLP Annex VI, index 613-086-00-5). So solid caffeine is never opened in front of the class: the vial on the desk stays sealed, and the smell-test solution and the IR sample are prepared beforehand by the teacher or a technician in the prep room, following the safety data sheet. The solution jar stays in the teacher’s hands, is labelled on the bottom with the name, CAS 58-08-2 and H302, and is never drunk, passed round or poured; wash hands afterwards and follow your school’s risk assessment for chemicals. Grow the crystals in the prep room, not in class, take care with the hot water, and show them only sealed; never heat or melt caffeine in the classroom (it melts at about 236 °C; PubChem, citing the CRC Handbook). Smelling is optional: use closed jars opened briefly, never sprays, and let students with asthma or a sensitivity to smells skip it and simply hear the result from a classmate. Never scent the model itself: caffeine is odourless, so a model that smells of coffee would teach exactly the wrong lesson. Keep brands covered. Many teenagers drink energy drinks, so let the facts do the work rather than lecturing. For adults, EFSA found that single doses of up to 200 mg and habitual intake of up to 400 mg a day raise no safety concerns; for children and adolescents it found the data insufficient to derive a safe intake and suggested 3 mg per kg of body weight per day as a basis (EFSA Panel on Dietetic Products, Nutrition and Allergies, 2015). A student can work out what that means for their own body weight, which is often the moment the label suddenly becomes interesting.
Help us answer the question. We are looking for chemistry teachers, lecturers and education researchers who would like to run any of these studies with their students, or simply try the four versions in class and tell us what happened. Teachers receive ready-to-print models free of charge. Write to pure@molgod.org.
Need a different molecule for your lesson? Send us its name or CAS number and we will prepare a printable model with engraved atoms; we confirm the timing for each substance.
13. FAQ
Are you claiming that engraved models make students learn faster?
No. We are claiming that there are good reasons to expect a specific, measurable benefit, and we have described how we will check it. Until the data exist, the effect is a hypothesis, and we do not put a percentage on it.
Why not simply compare your model with a normal one?
Because “normal” can mean one colour or several. Comparing only D with A would mix the effect of colour with the effect of the letter. The 2 × 2 design separates them.
Why caffeine?
It is familiar to every student, small enough to hold, and contains four elements in a structure rich enough to make FIND and NAME tasks non-trivial. It has a close relative, theophylline, that makes a natural transfer test. And it is the molecule for which all four versions already exist as print-ready designs.
Will the four test models be available to other researchers?
Yes. We plan to publish the exact print files used in the study, with their checksums, together with the protocol, so that anyone can repeat the experiment with identical models.
How do you make the models?
With our own deterministic software, from PubChem computed 3D coordinates: the same record always produces the same mesh. The engraving is part of the solid geometry, not a sticker or a decal.
14. How to cite
Koska, A. (2026). Colour, letters, or both? Four versions of the same molecule and the experiments that will tell them apart. MolGod.org. https://molgod.org/colour-or-engraved-molecular-models/
References
All references in this list are peer-reviewed and were checked against their Crossref records on 31 October and 1 November 2026. Where we could not confirm a specific number from a paper’s abstract, we cite only its general finding.
- Baayen, R. H., Davidson, D. J., & Bates, D. M. (2008). Mixed-effects modeling with crossed random effects for subjects and items. Journal of Memory and Language, 59(4), 390–412. https://doi.org/10.1016/j.jml.2007.12.005
- Birch, J. (2012). Worldwide prevalence of red-green color deficiency. Journal of the Optical Society of America A, 29(3), 313–320. https://doi.org/10.1364/JOSAA.29.000313
- Bodner, G. M., & Guay, R. B. (1997). The Purdue Visualization of Rotations Test. The Chemical Educator, 2(4), 1–17. https://doi.org/10.1007/s00897970138a
- Boiangiu, R.-Ş., Popa, L. N., & Mihășan, M. (2025). Impact of 3D-printed molecular models on student understanding of macromolecular structures: A compensatory research study. Biochemistry and Molecular Biology Education, 53(4), 358–369. https://doi.org/10.1002/bmb.21902
- Chandler, P., & Sweller, J. (1991). Cognitive load theory and the format of instruction. Cognition and Instruction, 8(4), 293–332. https://doi.org/10.1207/s1532690xci0804_2
- Endeshaw, H., Akowuah, C., Asaed, T., Brown, V., Cua, K., Dang, M., Giwa, E., Gonzalez, J., et al. (2025). Multicolor 3D-printed molecular orbital models for a first-semester organic chemistry course. Journal of Chemical Education, 102(1), 194–206. https://doi.org/10.1021/acs.jchemed.4c00945
- Endeshaw, H., Gonzalez, J., & O’Leary, D. (2026). 3D-printed multicolor molecular orbital models for a second-semester organic chemistry course. Journal of Chemical Education, 103(6), 3009–3021. https://doi.org/10.1021/acs.jchemed.5c01295
- Enright, G. D., Terskikh, V. V., Brouwer, D. H., & Ripmeester, J. A. (2007). The structure of two anhydrous polymorphs of caffeine from single-crystal diffraction and ultrahigh-field solid-state 13C NMR spectroscopy. Crystal Growth & Design, 7(8), 1406–1410. https://doi.org/10.1021/cg070291o
- Fakhruddin, H. (2008). Some activities with polarized light from a laptop LCD screen. The Physics Teacher, 46(4), 229–231. https://doi.org/10.1119/1.2895673
- Faul, F., Erdfelder, E., Lang, A.-G., & Buchner, A. (2007). G*Power 3: A flexible statistical power analysis program for the social, behavioral, and biomedical sciences. Behavior Research Methods, 39(2), 175–191. https://doi.org/10.3758/BF03193146
- Ginns, P. (2006). Integrating information: A meta-analysis of the spatial contiguity and temporal contiguity effects. Learning and Instruction, 16(6), 511–525. https://doi.org/10.1016/j.learninstruc.2006.10.001
- Hart, S. G. (2006). NASA-Task Load Index (NASA-TLX); 20 years later. Proceedings of the Human Factors and Ergonomics Society Annual Meeting, 50(9), 904–908. https://doi.org/10.1177/154193120605000909
- Harle, M., & Towns, M. (2011). A review of spatial ability literature, its connection to chemistry, and implications for instruction. Journal of Chemical Education, 88(3), 351–360. https://doi.org/10.1021/ed900003n
- Johnson, C. I., & Mayer, R. E. (2012). An eye movement analysis of the spatial contiguity effect in multimedia learning. Journal of Experimental Psychology: Applied, 18(2), 178–191. https://doi.org/10.1037/a0026923
- Johnstone, A. H. (1991). Why is science difficult to learn? Things are seldom what they seem. Journal of Computer Assisted Learning, 7(2), 75–83. https://doi.org/10.1111/j.1365-2729.1991.tb00230.x
- Kalyuga, S., Ayres, P., Chandler, P., & Sweller, J. (2003). The expertise reversal effect. Educational Psychologist, 38(1), 23–31. https://doi.org/10.1207/S15326985EP3801_4
- Kozma, R. B., & Russell, J. (1997). Multimedia and understanding: Expert and novice responses to different representations of chemical phenomena. Journal of Research in Science Teaching, 34(9), 949–968. https://doi.org/10.1002/(SICI)1098-2736(199711)34:9<949::AID-TEA7>3.0.CO;2-U
- Lakens, D. (2017). Equivalence tests: A practical primer for t tests, correlations, and meta-analyses. Social Psychological and Personality Science, 8(4), 355–362. https://doi.org/10.1177/1948550617697177
- Lehmann, C. W., & Stowasser, F. (2007). The crystal structure of anhydrous β-caffeine as determined from X-ray powder-diffraction data. Chemistry – A European Journal, 13(10), 2908–2911. https://doi.org/10.1002/chem.200600973
- Lo, S., & Andrews, S. (2015). To transform or not to transform: Using generalized linear mixed models to analyse reaction time data. Frontiers in Psychology, 6, 1171. https://doi.org/10.3389/fpsyg.2015.01171
- Martin, H., Eisner, E., & Klosterman, J. K. (2023). Accessible 3D printing: Multicolor molecular models from consumer-grade, single filament 3D printers. Journal of Chemical Education, 100(12), 4860–4865. https://doi.org/10.1021/acs.jchemed.3c00686
- McCusker, R. R., Goldberger, B. A., & Cone, E. J. (2003). Caffeine content of specialty coffees. Journal of Analytical Toxicology, 27(7), 520–522. https://doi.org/10.1093/jat/27.7.520
- Nosek, B. A., Ebersole, C. R., DeHaven, A. C., & Mellor, D. T. (2018). The preregistration revolution. Proceedings of the National Academy of Sciences, 115(11), 2600–2606. https://doi.org/10.1073/pnas.1708274114
- Paradkar, M. M., & Irudayaraj, J. (2002). Rapid determination of caffeine content in soft drinks using FTIR–ATR spectroscopy. Food Chemistry, 78(2), 261–266. https://doi.org/10.1016/S0308-8146(02)00116-4
- Pasieczna-Patkowska, S., Cichy, M., & Flieger, J. (2025). Application of Fourier transform infrared (FTIR) spectroscopy in characterization of green synthesized nanoparticles. Molecules, 30(3), 684. https://doi.org/10.3390/molecules30030684
- Paas, F. G. W. C. (1992). Training strategies for attaining transfer of problem-solving skill in statistics: A cognitive-load approach. Journal of Educational Psychology, 84(4), 429–434. https://doi.org/10.1037/0022-0663.84.4.429
- Paas, F. G. W. C., & Van Merriënboer, J. J. G. (1993). The efficiency of instructional conditions: An approach to combine mental effort and performance measures. Human Factors, 35(4), 737–743. https://doi.org/10.1177/001872089303500412
- Paivio, A. (1991). Dual coding theory: Retrospect and current status. Canadian Journal of Psychology, 45(3), 255–287. https://doi.org/10.1037/h0084295
- Richter, J., Scheiter, K., & Eitel, A. (2016). Signaling text-picture relations in multimedia learning: A comprehensive meta-analysis. Educational Research Review, 17, 19–36. https://doi.org/10.1016/j.edurev.2015.12.003
- Roberts, N. J., Hynes, T., Stacey, D., & MacDonald, J. L. (2023). How effective are indicators for individuals with color vision deficiency? Journal of Chemical Education, 100(11), 4168–4173. https://doi.org/10.1021/acs.jchemed.3c00413
- Roediger, H. L., & Karpicke, J. D. (2006). Test-enhanced learning: Taking memory tests improves long-term retention. Psychological Science, 17(3), 249–255. https://doi.org/10.1111/j.1467-9280.2006.01693.x
- Schneider, S., Beege, M., Nebel, S., & Rey, G. D. (2018). A meta-analysis of how signaling affects learning with media. Educational Research Review, 23, 1–24. https://doi.org/10.1016/j.edurev.2017.11.001
- Schroeder, N. L., & Cenkci, A. T. (2018). Spatial contiguity and spatial split-attention effects in multimedia learning environments: A meta-analysis. Educational Psychology Review, 30(3), 679–701. https://doi.org/10.1007/s10648-018-9435-9
- Singh, B. R., Wechter, M. A., Hu, Y., & Lafontaine, C. (1998). Determination of caffeine content in coffee using Fourier transform infra-red spectroscopy in combination with attenuated total reflectance technique: A bioanalytical chemistry experiment for biochemists. Biochemical Education, 26(3), 243–247. https://doi.org/10.1016/S0307-4412(98)00078-8
- Singhal, I., & Balaji, B. S. (2020). Creating atom representations using open-source, stackable 3D printed interlocking pieces with tactile features to support chemical equation writing for sighted and visually impaired students. Journal of Chemical Education, 97(1), 118–124. https://doi.org/10.1021/acs.jchemed.9b00255
- Srivastava, S. K., & Singh, V. B. (2013). Ab initio and DFT studies of the structure and vibrational spectra of anhydrous caffeine. Spectrochimica Acta Part A: Molecular and Biomolecular Spectroscopy, 115, 45–50. https://doi.org/10.1016/j.saa.2013.06.005
- Stieff, M., Lira, M. E., & Scopelitis, S. A. (2016). Gesture supports spatial thinking in STEM. Cognition and Instruction, 34(2), 80–99. https://doi.org/10.1080/07370008.2016.1145122
- Stull, A. T., Hegarty, M., Dixon, B., & Stieff, M. (2012). Representational translation with concrete models in organic chemistry. Cognition and Instruction, 30(4), 404–434. https://doi.org/10.1080/07370008.2012.719956
- Stull, A. T., & Hegarty, M. (2016). Model manipulation and learning: Fostering representational competence with virtual and concrete models. Journal of Educational Psychology, 108(4), 509–527. https://doi.org/10.1037/edu0000077
- Sunarharum, W. B., Williams, D. J., & Smyth, H. E. (2014). Complexity of coffee flavor: A compositional and sensory perspective. Food Research International, 62, 315–325. https://doi.org/10.1016/j.foodres.2014.02.030
- Talanquer, V. (2011). Macro, submicro, and symbolic: The many faces of the chemistry “triplet”. International Journal of Science Education, 33(2), 179–195. https://doi.org/10.1080/09500690903386435
- Treisman, A. M., & Gelade, G. (1980). A feature-integration theory of attention. Cognitive Psychology, 12(1), 97–136. https://doi.org/10.1016/0010-0285(80)90005-5
- Wolfe, J. M., & Horowitz, T. S. (2004). What attributes guide the deployment of visual attention and how do they do it? Nature Reviews Neuroscience, 5(6), 495–501. https://doi.org/10.1038/nrn1411
Regulatory and reference sources
Used only in the lesson plan: one EFSA scientific opinion, one EU food-labelling regulation (wording checked against the published text), the EU harmonised classification of caffeine (read from ECHA’s published export), NIST reference spectra (gas and solid), an open ATR-FTIR dataset and one entry in a reference database that cites its primary sources.
- EFSA Panel on Dietetic Products, Nutrition and Allergies (NDA). (2015). Scientific opinion on the safety of caffeine. EFSA Journal, 13(5), 4102. https://doi.org/10.2903/j.efsa.2015.4102
- Regulation (EU) No 1169/2011 of the European Parliament and of the Council of 25 October 2011 on the provision of food information to consumers, Annex III, point 4.1. http://data.europa.eu/eli/reg/2011/1169/oj
- Linstrom, P. J., & Mallard, W. G. (Eds.). NIST Chemistry WebBook, NIST Standard Reference Database Number 69. National Institute of Standards and Technology. Caffeine, IR spectra: gas phase (Sadtler Research Labs under US-EPA contract), as shown in the MolGod viewer, band positions read from the data on 1 November 2026; and solid (Pacific Northwest National Laboratory, Bruker Tensor 37 FTIR, diffuse reflectance, March 2017, public domain). https://doi.org/10.18434/T4D303
- Abdull Manap, M. R. (2018). Analysis of caffeine powder by ATR-FTIR (Version 1) [Data set]. Mendeley Data. Caffeine anhydrous (Sigma), normalised spectrum. https://doi.org/10.17632/j8m6sfnh5f.1
- European Chemicals Agency (ECHA). Harmonised classification and labelling, Annex VI to Regulation (EC) No 1272/2008 (CLP): caffeine, EC 200-362-1, CAS 58-08-2, index 613-086-00-5, Acute Tox. 4*, H302 (export of 7 July 2026). https://echa.europa.eu/information-on-chemicals/annex-vi-to-clp
- PubChem. Caffeine (CID 2519), sections Odor (“Odorless”), Solubility (1 g in 46 mL water, 5.5 mL water at 80 °C, 1.5 mL boiling water) and Color/Form (“hexagonal prisms”), citing O’Neil, M. J. (Ed.). (2013). The Merck Index. Royal Society of Chemistry; Color/Form (“long, flexible, silky crystals”), citing Lewis, R. J. Sr. Hawley’s Condensed Chemical Dictionary (15th ed.). Wiley; Melting Point (236.2 °C), citing Haynes, W. M. (Ed.). CRC Handbook of Chemistry and Physics (94th ed.). CRC Press. https://pubchem.ncbi.nlm.nih.gov/compound/2519